

Infogram
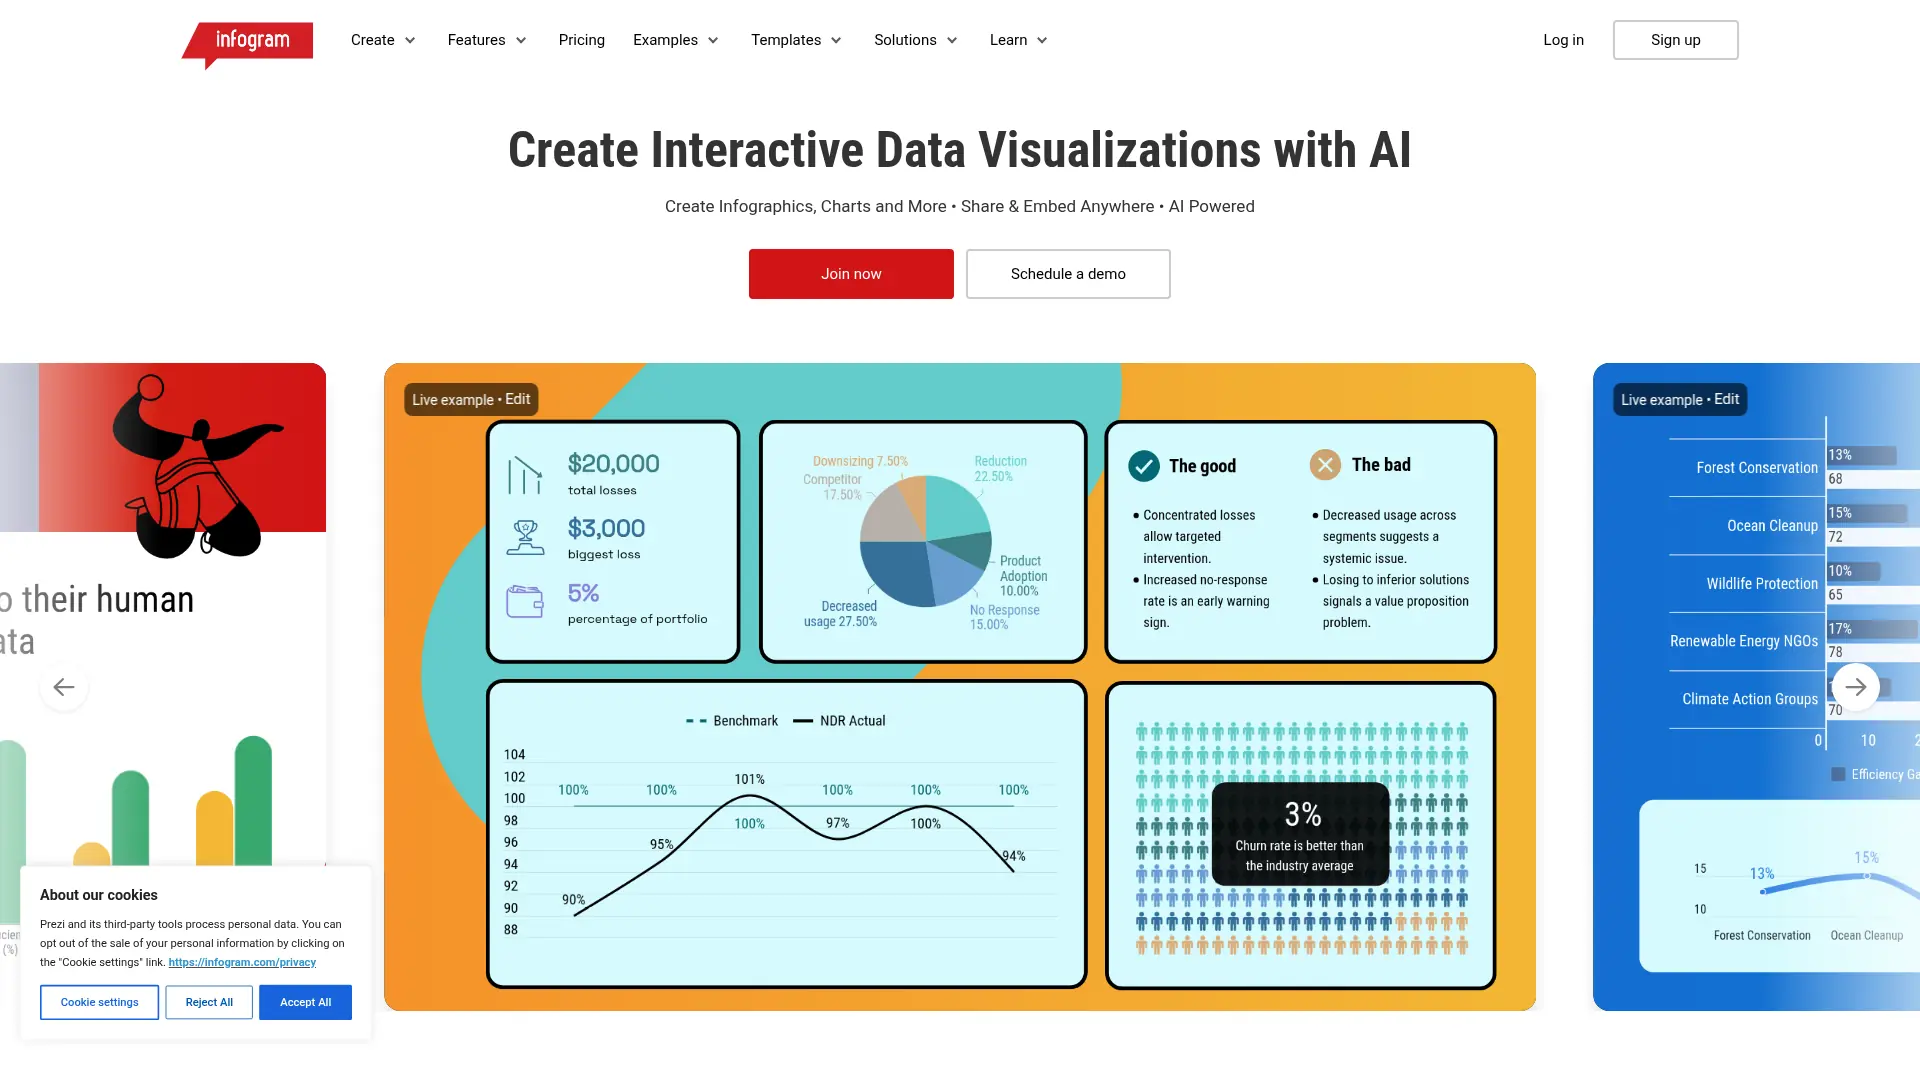
What is Infogram?
Infogram is a web-based data visualization platform for creating interactive infographics, charts, maps, reports, dashboards, slides, and other visual content. Its editor combines templates, data import, animation, embedding, analytics, and AI-assisted tools to help users communicate information more clearly. The platform serves journalists, marketers, researchers, educators, nonprofits, government teams, and business professionals. Users can publish visuals online, embed them without coding, download selected formats, or automate recurring visualizations through the Infogram API. Its main differentiator is the combination of accessible visual storytelling, extensive chart and map libraries, interactive publishing, and enterprise workflow features.
How to use Infogram?
Sign up for a free Infogram account and choose a template or start a blank project; import or enter your data and customize charts, maps, text, branding, and interactive elements; publish, embed, share, or export the completed visualization.
Infogram's Core Features
Interactive Visualizations: Add clickable elements, hover details, animations, videos, and GIFs to make data easier to explore.
Charts and Maps: Turn datasets into customizable visuals using more than 35 chart types and 800 map types.
Data Import: Bring information into projects from spreadsheets, PDFs, Google Drive, databases, JSON feeds, and other supported sources.
Templates: Start faster with customizable templates for infographics, reports, dashboards, maps, charts, slides, posters, and social graphics.
AI Assistance: Generate visual layouts, receive chart suggestions, and convert images into data-driven visuals.
Embedding and Sharing: Publish responsive projects online and embed them in websites, blogs, presentations, or articles without coding.
Brand Kit: Apply saved logos, colors, fonts, and visual assets to maintain consistent branded content.
Engagement Analytics: Measure how audiences interact with published visual content on eligible plans.
Team Collaboration: Work with multiple users through real-time collaboration, commenting, team templates, and shared workflows.
API Automation: Programmatically copy, update, publish, unpublish, download, and export projects for recurring visualization workflows.
Infogram's Use Cases
- #1
Journalists creating interactive charts and maps for data-driven news articles
- #2
Marketing teams building branded infographics for campaigns, reports, and presentations
- #3
Researchers turning survey results and complex datasets into accessible visual reports
- #4
Educators designing interactive lessons, timelines, charts, and visual explanations
- #5
Nonprofits presenting impact metrics, annual results, and advocacy data online
- #6
Government communication teams publishing election results and public data visualizations
- #7
Businesses creating dashboards and recurring reports from connected or imported data
- #8
Publishers embedding responsive charts and infographics into websites without coding
Frequently Asked Questions
Analytics of Infogram
Monthly Visits Trend: Jun 2025 - Aug 2026
Traffic Sources
AI Channel Traffic Trends
Top Regions
| Region | Traffic Share |
|---|---|
| United States | 17.55% |
| Brazil | 11.17% |
| Germany | 5.96% |
| Mexico | 4.32% |
| India | 4.32% |
Top Keywords
| Keyword | Traffic | CPC |
|---|---|---|
| infogram | 9.3K | $2.26 |
| viet69 | 643.3K | -- |
| mawartoto | 22.4K | $0.24 |
| phimmoichill | 109.1K | $0.54 |
| infographic | 270.3K | $1.12 |
Alternative of Infogram
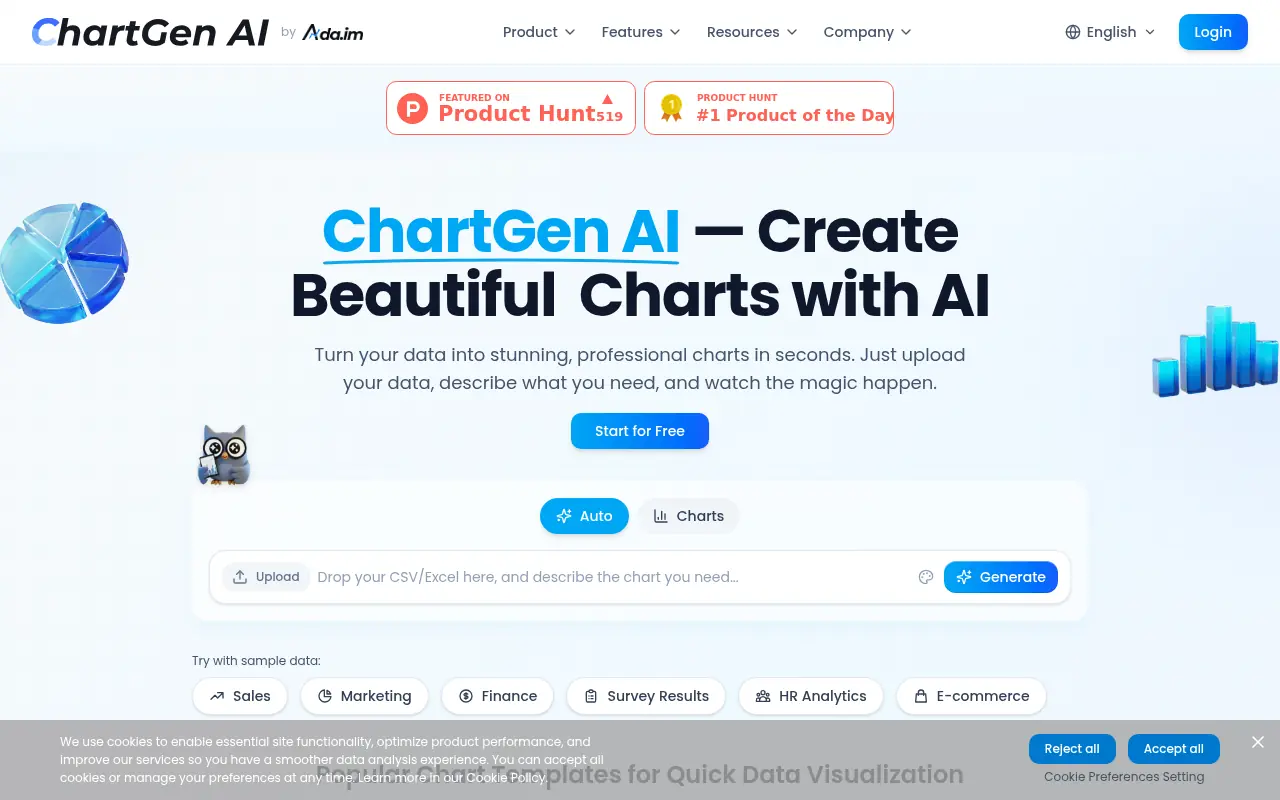

ChartGen AI
ChartGen AI is an intelligent data visualization tool that turns raw data into professional charts and graphs instantly using natural language prompts.
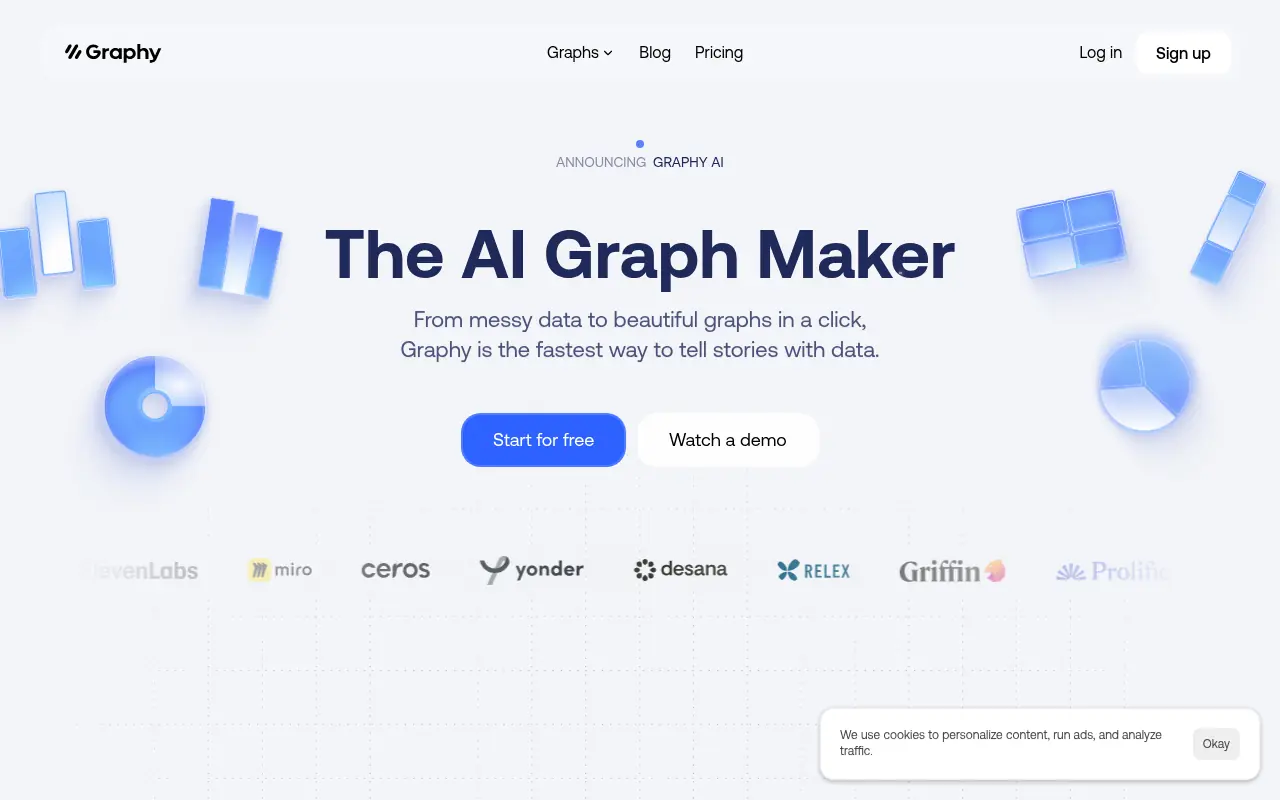

Graphy
Graphy is an AI-powered tool that allows users to analyze data and create interactive charts, graphs, and dashboards rapidly.

Hint
Hint is an AI-powered platform for personalized astrology insights and horoscope predictions.

Graph Maker
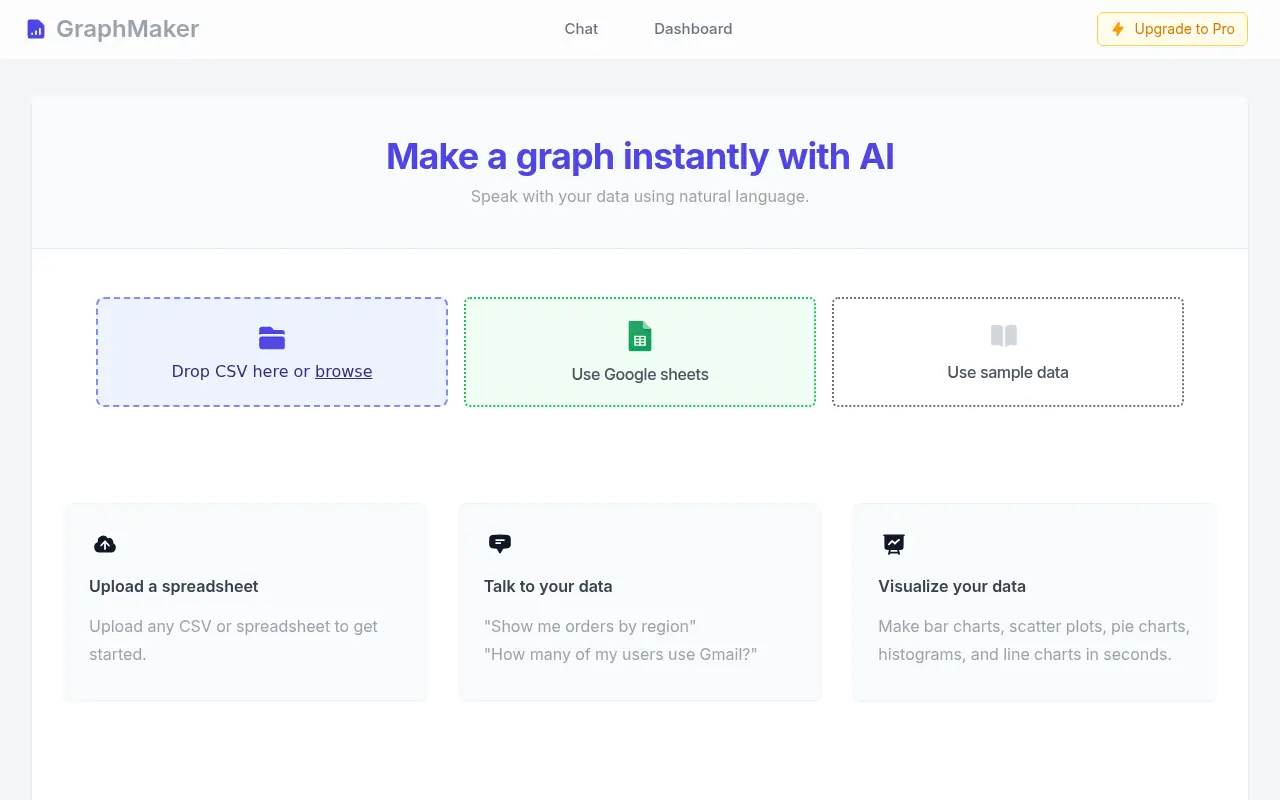
Graph Maker is an AI-powered web tool that allows users to create professional charts and graphs in seconds, supporting various chart types with easy customization and data import options.

Ultimaps
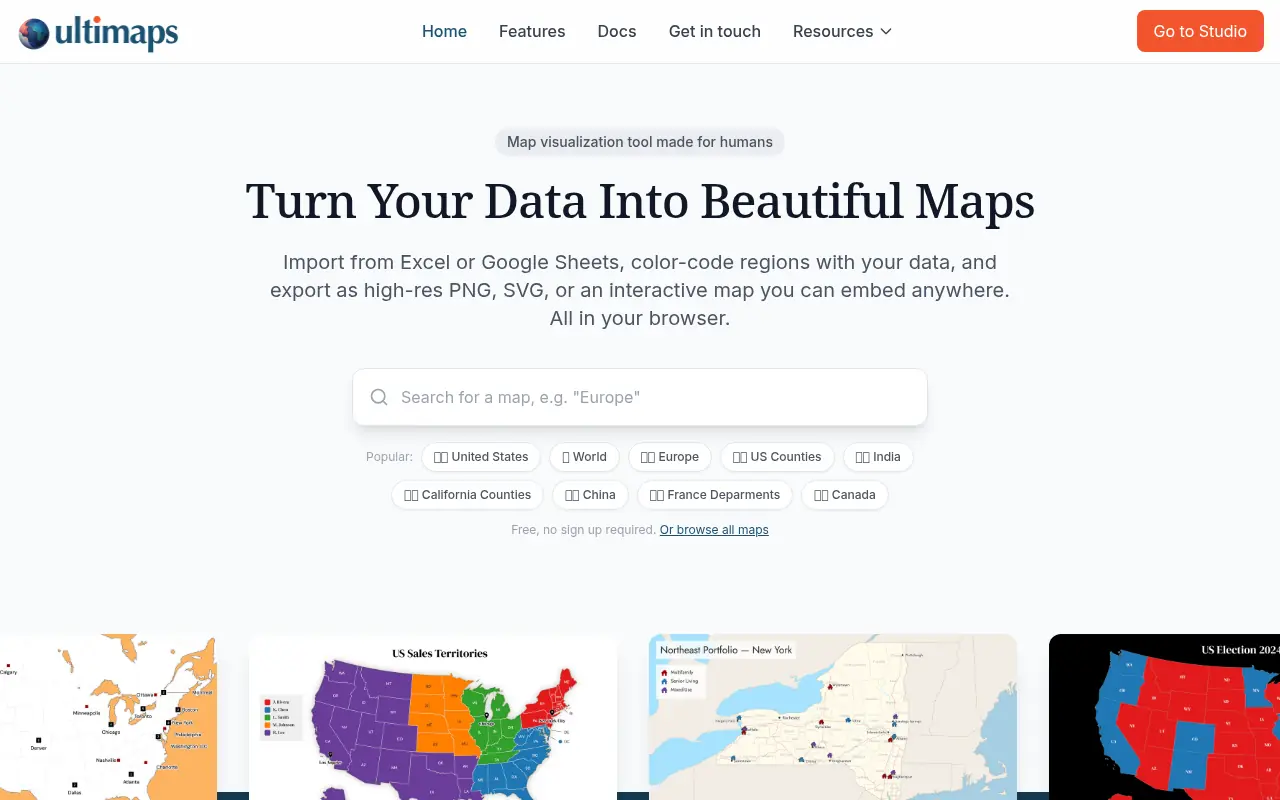
Ultimaps is a no-code custom map maker and data visualization tool that lets users easily turn spreadsheets or AI prompts into beautiful, interactive maps.


Genially
Genially is a versatile online platform for creating interactive, animated presentations, infographics, and engaging digital content without needing programming skills.


Tableau
Tableau is a powerful visual analytics platform that empowers individuals and organizations to explore, analyze, and securely share actionable data insights.

Slidesgo
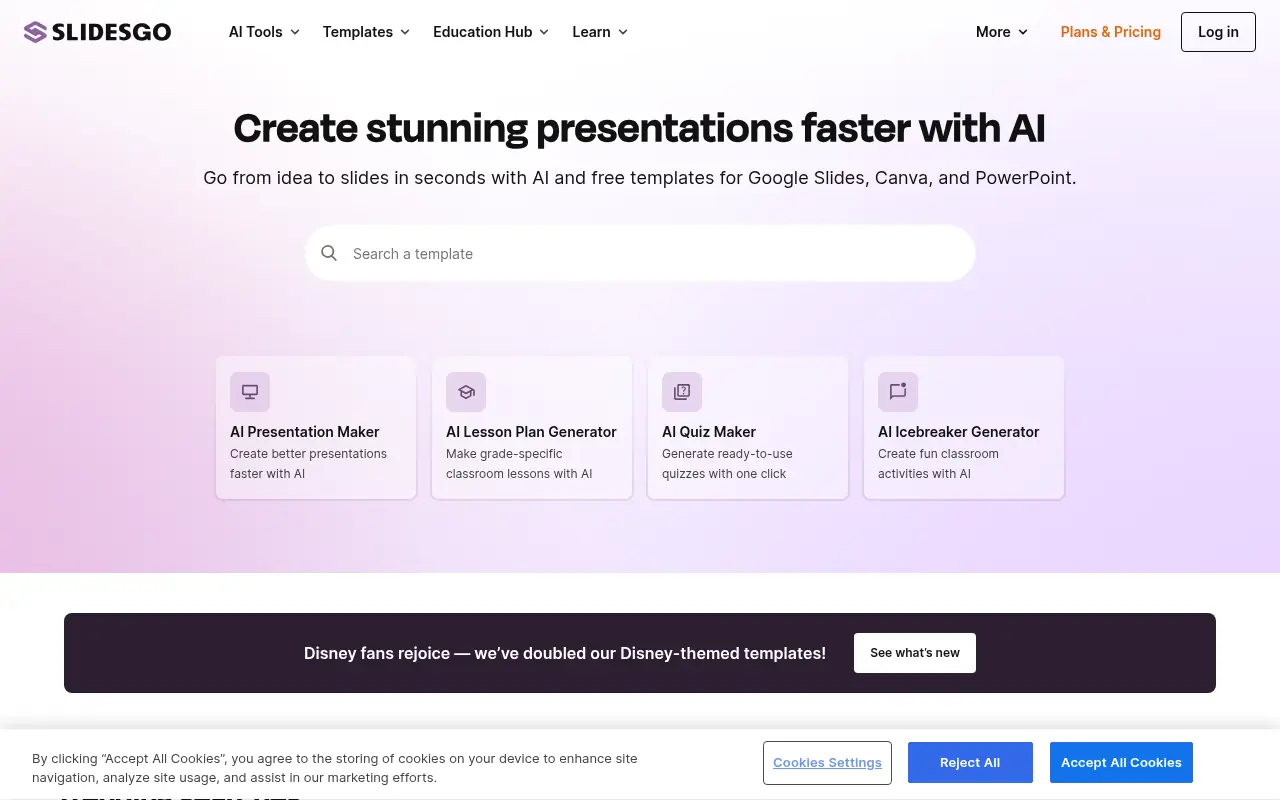
Slidesgo provides free and premium professionally designed presentation templates compatible with Google Slides and PowerPoint for education, business, marketing, and more.