Ultimaps
What is Ultimaps?
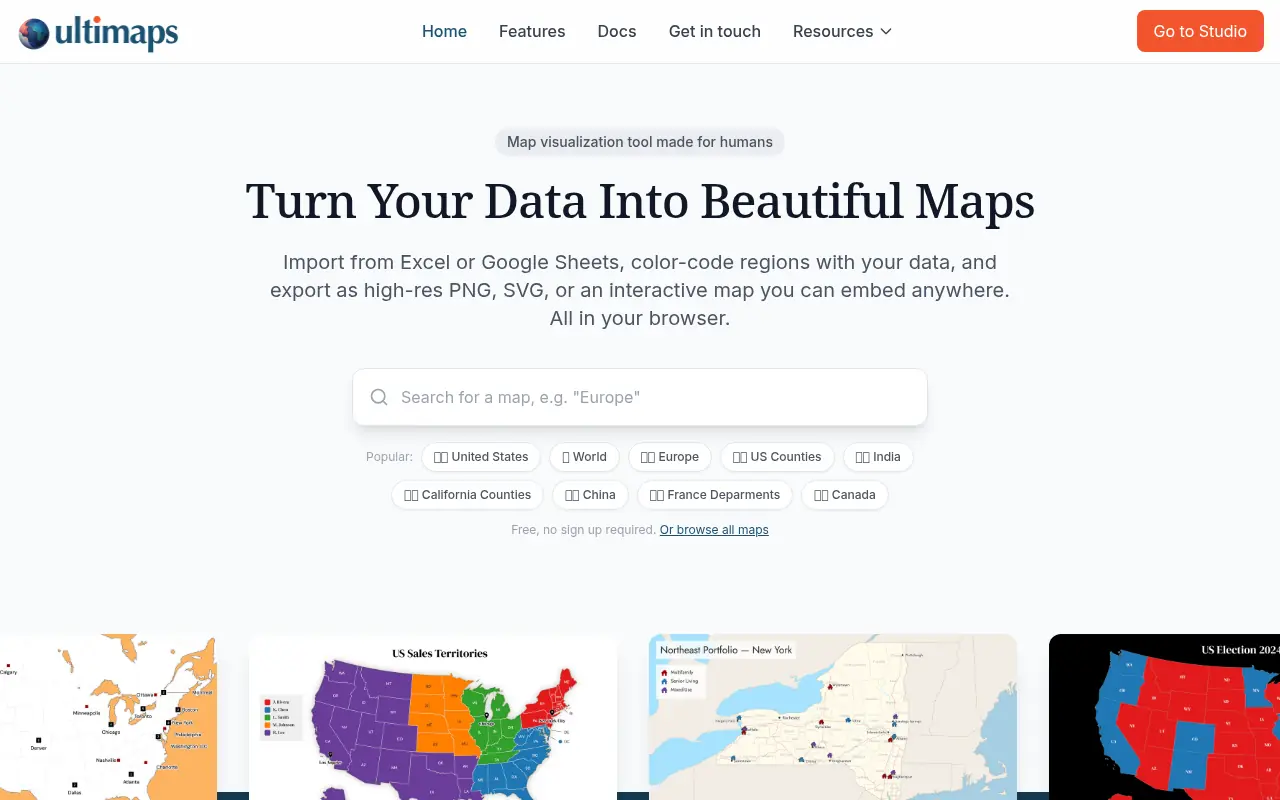
Ultimaps is an online application designed to simplify the creation of color-coded and interactive maps for professionals and individuals. Its mission is to make map-based data visualization accessible without requiring complex GIS software or specialized design skills. Users can easily import data from Excel, Google Sheets, or Notion, or simply use AI prompts to generate customized maps on the fly. The platform serves diverse groups, including sales teams, researchers, real estate professionals, and marketers. By enabling users to create, share, and embed dynamic maps, Ultimaps ensures that complex geographical data is communicated clearly and professionally.
How to use Ultimaps?
To use Ultimaps, start by selecting from over 100 vector maps, including US states, counties, or global regions. Next, add your data by pasting it from an Excel or CSV file, connecting to Google Sheets or Notion, or simply typing an AI prompt to generate the data mapping automatically. Finally, customize the colors, themes, and annotations, then export the map as a high-resolution image (PNG/SVG/PDF) or copy the embed code to publish a live, interactive version directly on your website.
Ultimaps's Core Features
Access a library of over 100 vector maps for countries, states, and counties.
Import data seamlessly via CSV, Excel, Google Sheets, or Notion integrations.
Use intelligent AI prompts to automatically color, populate, and format map regions.
Export high-resolution maps locally in PNG, SVG, or PDF formats.
Publish interactive maps and embed them on any website with a single line of code.
Add custom hover tooltips and clickable popups to provide rich context for each mapped region.
Ultimaps's Use Cases
- #1
Designing sales territory maps to visualize rep coverage and regional performance.
- #2
Creating real estate portfolio maps for investor reports and property tracking.
- #3
Generating election and political maps to cleanly display regional voting outcomes.
- #4
Visualizing demographic and research data for academic, media, or classroom use.
- #5
Building interactive business presence maps to show store or office locations on a corporate website.
Frequently Asked Questions
Analytics of Ultimaps
Monthly Visits Trend: Apr 2025 - May 2026
Traffic Sources
AI Channel Traffic Trends
Top Regions
| Region | Traffic Share |
|---|---|
| United States | 44.59% |
| India | 13.66% |
| United Kingdom | 4.45% |
| Canada | 2.56% |
| Nigeria | 2.36% |
Top Keywords
| Keyword | Traffic | CPC |
|---|---|---|
| what county am i in | 25.9K | -- |
| ultimaps | 680 | -- |
| map of eurasia | 6.5K | -- |
| asia map | 96.8K | $0.78 |
| blank map of the united states | 2.2K | $1.06 |
Alternative of Ultimaps
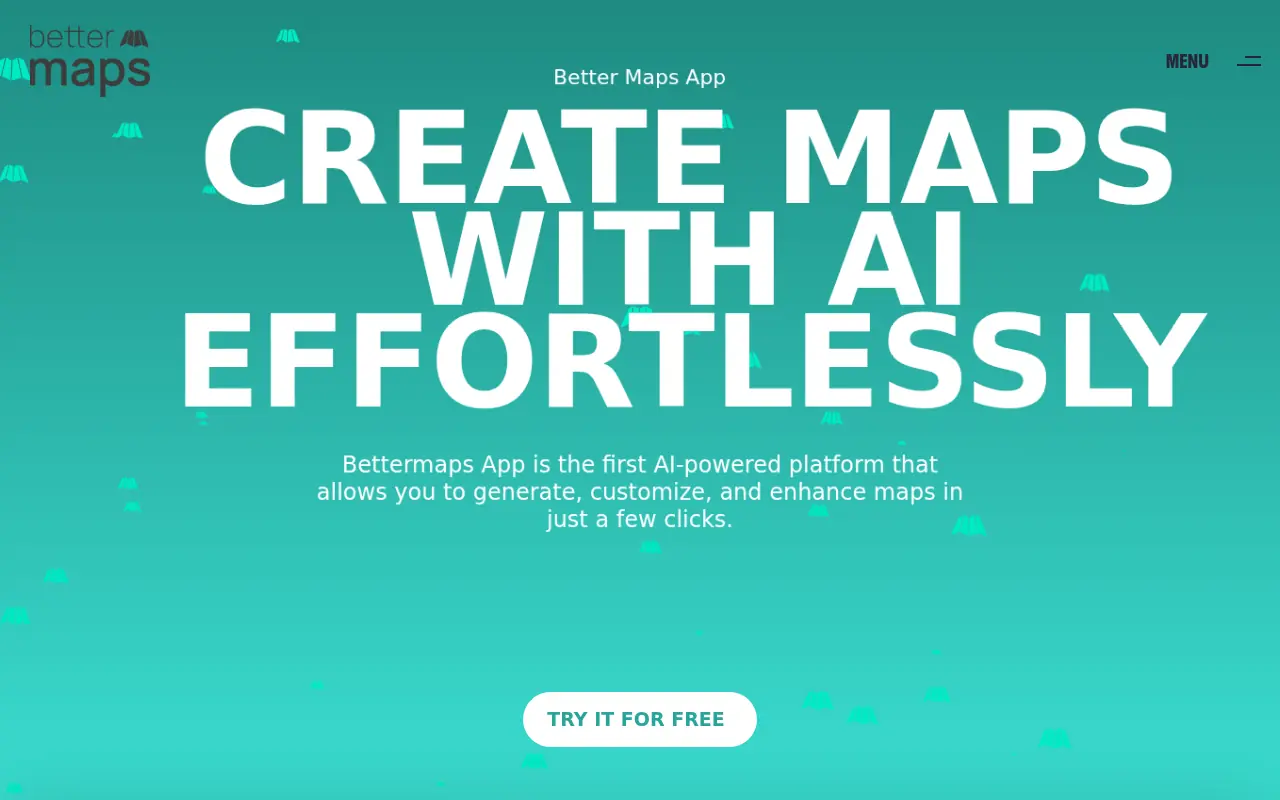
Bettermaps
Bettermaps is an AI-powered digital mapping platform that allows users to effortlessly generate, customize, and extract structured data from maps and historical documents.
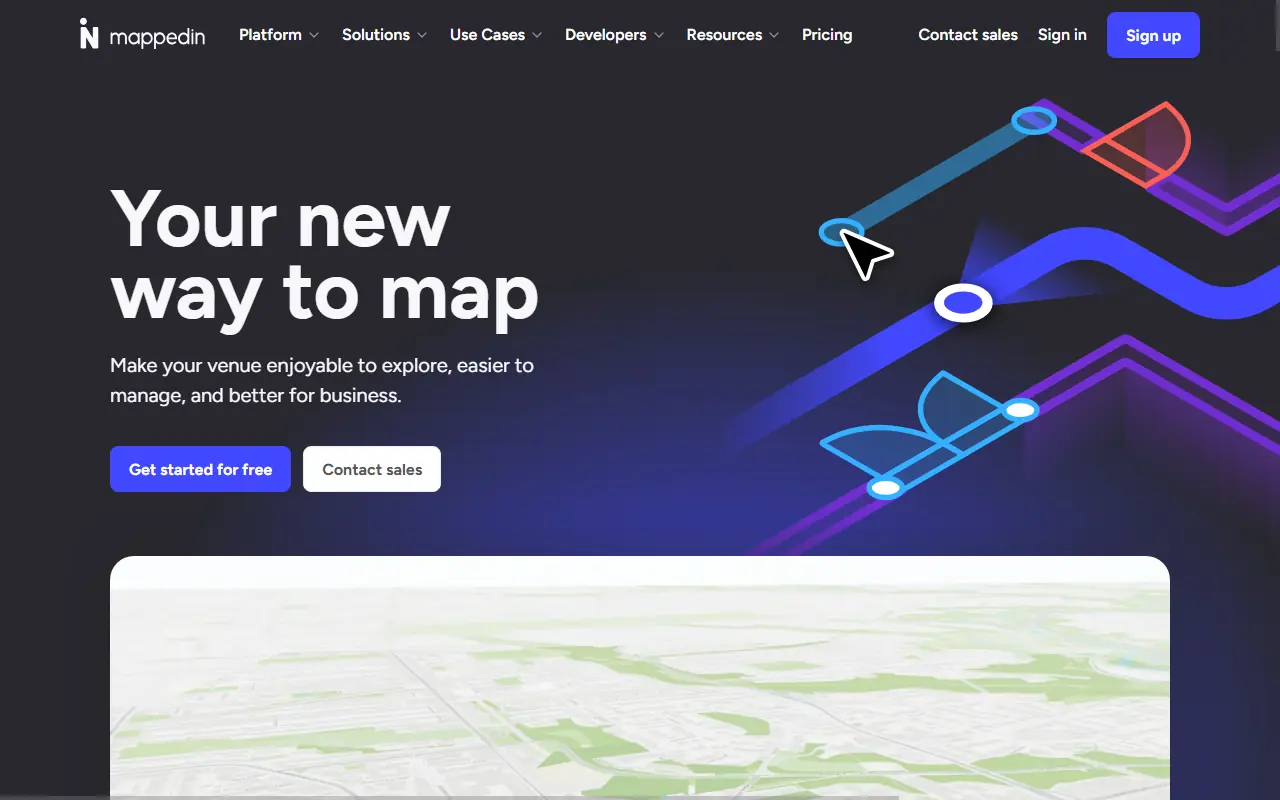
Mappedin
Mappedin provides indoor mapping and wayfinding solutions to enhance navigation and experiences in large venues like malls, airports, and offices.
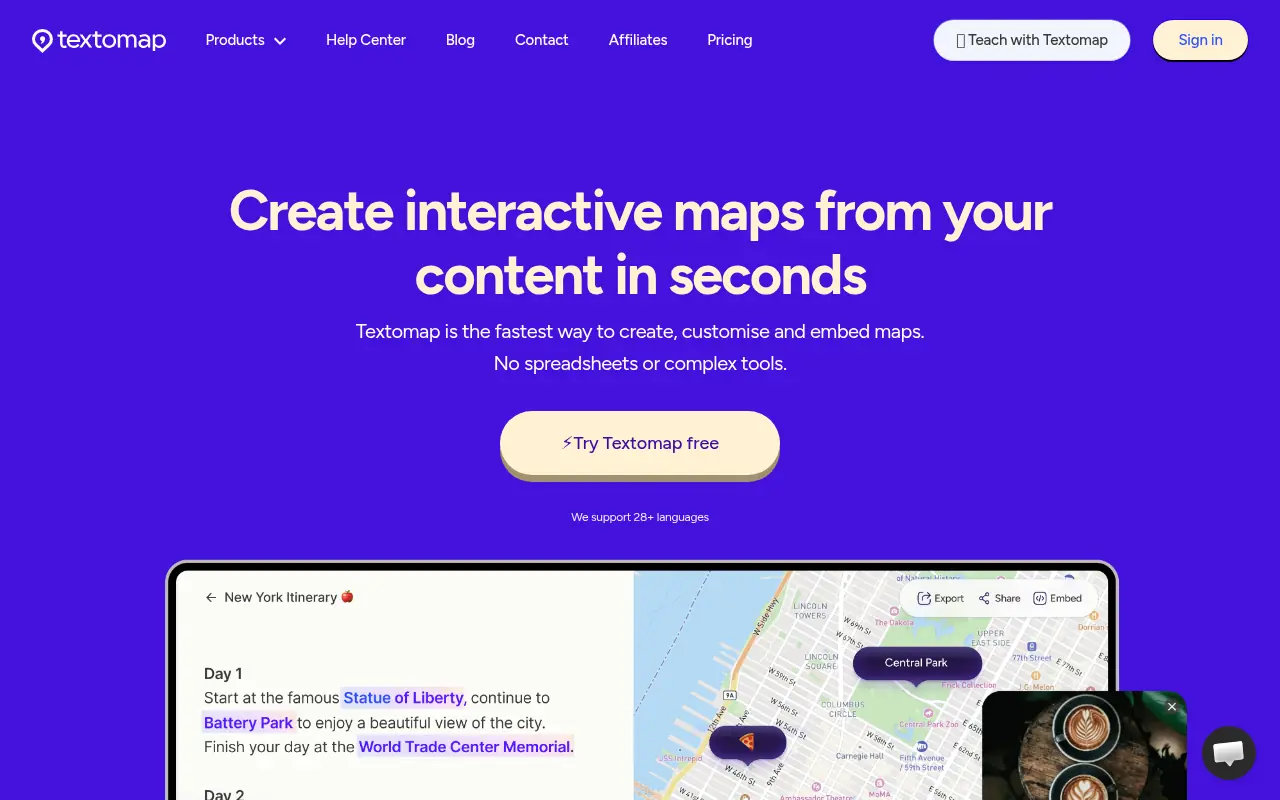
Textomap
Textomap is an AI-powered tool that instantly generates interactive maps from text, images, prompts, websites, and audio files.
EOS Data Analytics
EOS Data Analytics provides AI-powered satellite imagery analytics and Earth observation solutions primarily for precision agriculture and forestry management.
AI Dungeon
AI Dungeon is an AI-powered interactive storytelling platform that allows users to create and experience infinite text-based adventures and role-playing games.

Hex
Hex is a collaborative, AI-powered analytics workspace for data science and decision-making.

Lume AI
Lume AI was an AI-powered data mapping and integration platform that recently closed its standalone services after the team joined Harvey in March 2026.
StarryAI
StarryAI is an AI-powered art generator that transforms text prompts into high-quality digital artworks.