Graph Maker
What is Graph Maker?
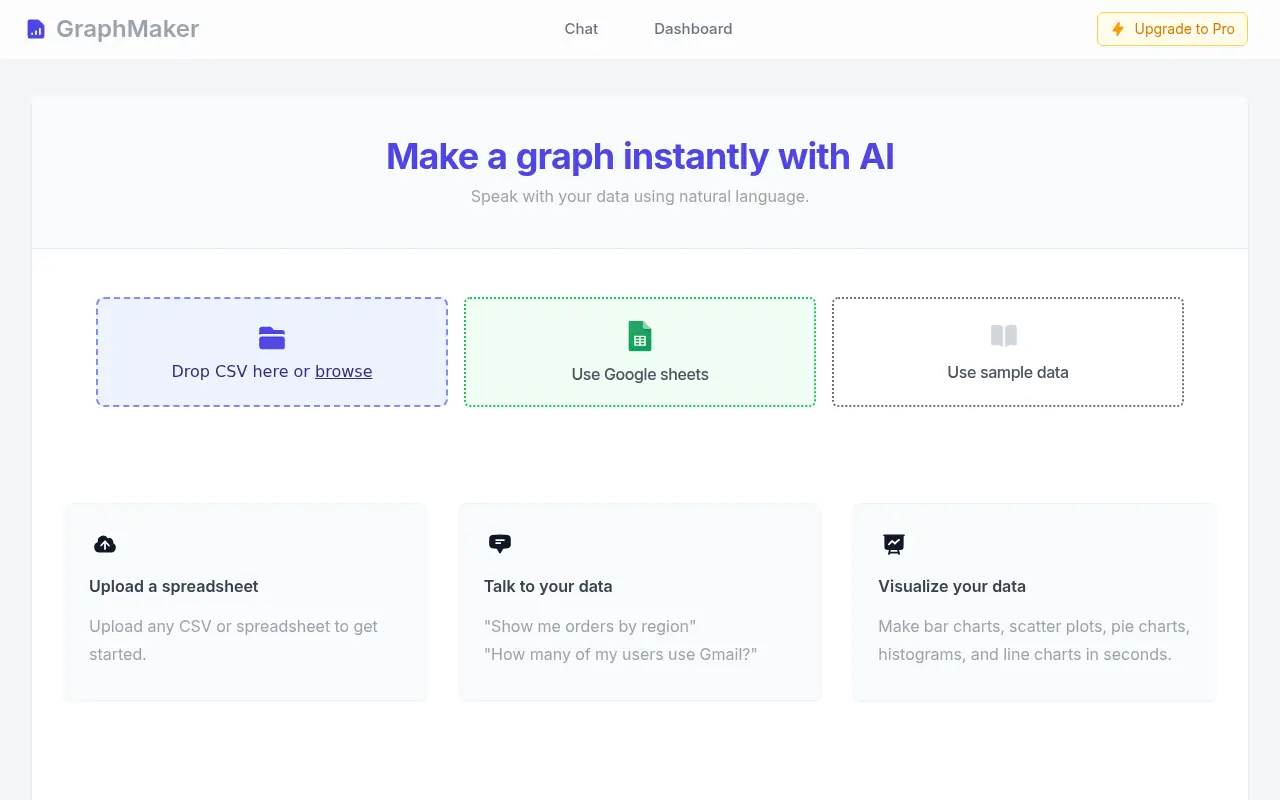
Graph Maker is a browser-based, AI-driven platform designed to streamline the process of data visualization for anyone needing quick, professional charts and graphs.It accepts raw or formatted data from manual entry, CSV, Excel, and other sources, automatically generating visuals such as bar charts, scatter plots, histograms, pie charts, and line charts.Its mission is to democratize data presentation by enabling users—regardless of technical skill—to transform data into insightful visuals in moments. The site leverages artificial intelligence to interpret data, recommend chart types, and apply design best practices, making sophisticated data visualization accessible to businesses, educators, researchers, and analysts. Data privacy is emphasized, ensuring uploaded files are protected and compliant with modern security standards.By automating customization and export, Graph Maker helps users save time and enhance the clarity and impact of their presentations.
How to use Graph Maker?
To use Graph Maker, start by visiting the website and selecting the type of graph you want. Upload your data by pasting it in, or importing from CSV, Excel, or other supported file formats. The AI will instantly analyze your data and recommend suitable chart types. You can then customize your chart by changing colors, labels, and layout options, before exporting the finished graph in the desired format (such as PNG, SVG, or PDF).No account or coding skill is required, making the workflow fast and straightforward for users of any background.
Graph Maker's Core Features
Instant AI-powered graph generation from raw or formatted data.
Supports multiple chart types: bar, pie, scatter, histogram, line, Gantt, and more.
Customizable colors, labels, and axis options.
Seamless import of data from CSV, Excel, or manual entry.
Export charts in multiple formats including PNG, SVG, and PDF.
No coding or software installation required; fully browser-based.
Fast processing—generate charts in seconds.
Dedicated focus on data privacy and security compliance.
Unlimited graph creation with no restrictions.
Multilingual support for user interface and documentation.
Graph Maker's Use Cases
- #1
Create quick bar charts for sales or marketing reports.
- #2
Visualize survey results as pie or line charts for academic research.
- #3
Generate Gantt charts for project management timelines.
- #4
Design data-driven infographics for presentations or publications.
- #5
Map entity relationships for technical, business, or educational purposes.
- #6
Track progress with scatter plots in scientific experimentation.
- #7
Prepare timelines for historical or event planning documentation.
- #8
Develop knowledge graphs for machine learning and semantic analysis.
Frequently Asked Questions
Analytics of Graph Maker
Monthly Visits Trend: Jun 2025 - May 2026
Traffic Sources
Top Regions
| Region | Traffic Share |
|---|---|
| United States | 26.44% |
| Brazil | 11.87% |
| United Kingdom | 8.45% |
| India | 7.11% |
| Germany | 6.13% |
Top Keywords
| Keyword | Traffic | CPC |
|---|---|---|
| graph maker ai | 2.0K | $0.23 |
| graph maker | 60.2K | $1.49 |
| graph chart maker ai | 390 | -- |
| excel to graph ai | 380 | -- |
| ai tool for bar chart | -- | -- |
Alternative of Graph Maker
Graphy
Graphy is an AI-powered tool that allows users to analyze data and create interactive charts, graphs, and dashboards rapidly.
ChartGen AI
ChartGen AI is an intelligent data visualization tool that turns raw data into professional charts and graphs instantly using natural language prompts.

Hint
Hint is an AI-powered platform for personalized astrology insights and horoscope predictions.
Coefficient
Coefficient enables users to connect data sources and automate live data workflows directly within Google Sheets and Excel.
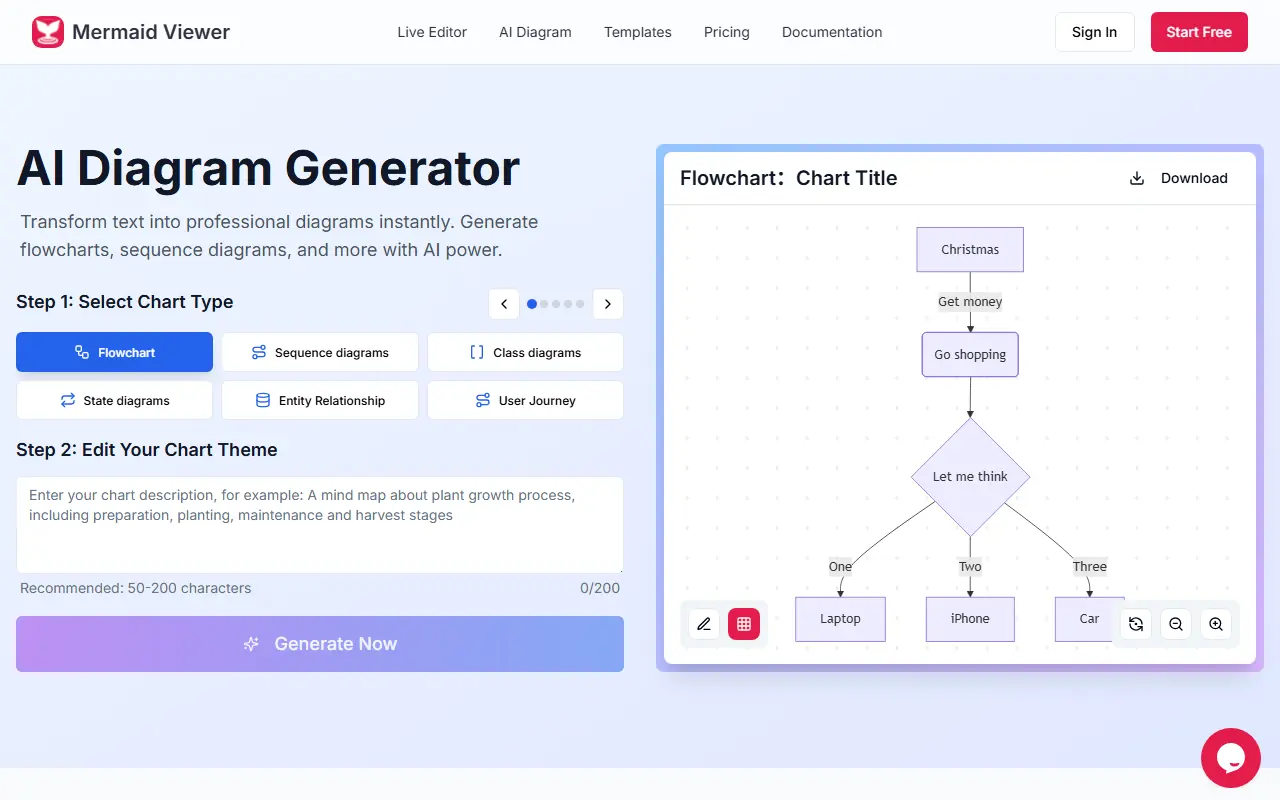
Mermaid Viewer
A browser-based tool that uses AI to transform text descriptions into professional Mermaid diagrams, flowcharts, and charts instantly.
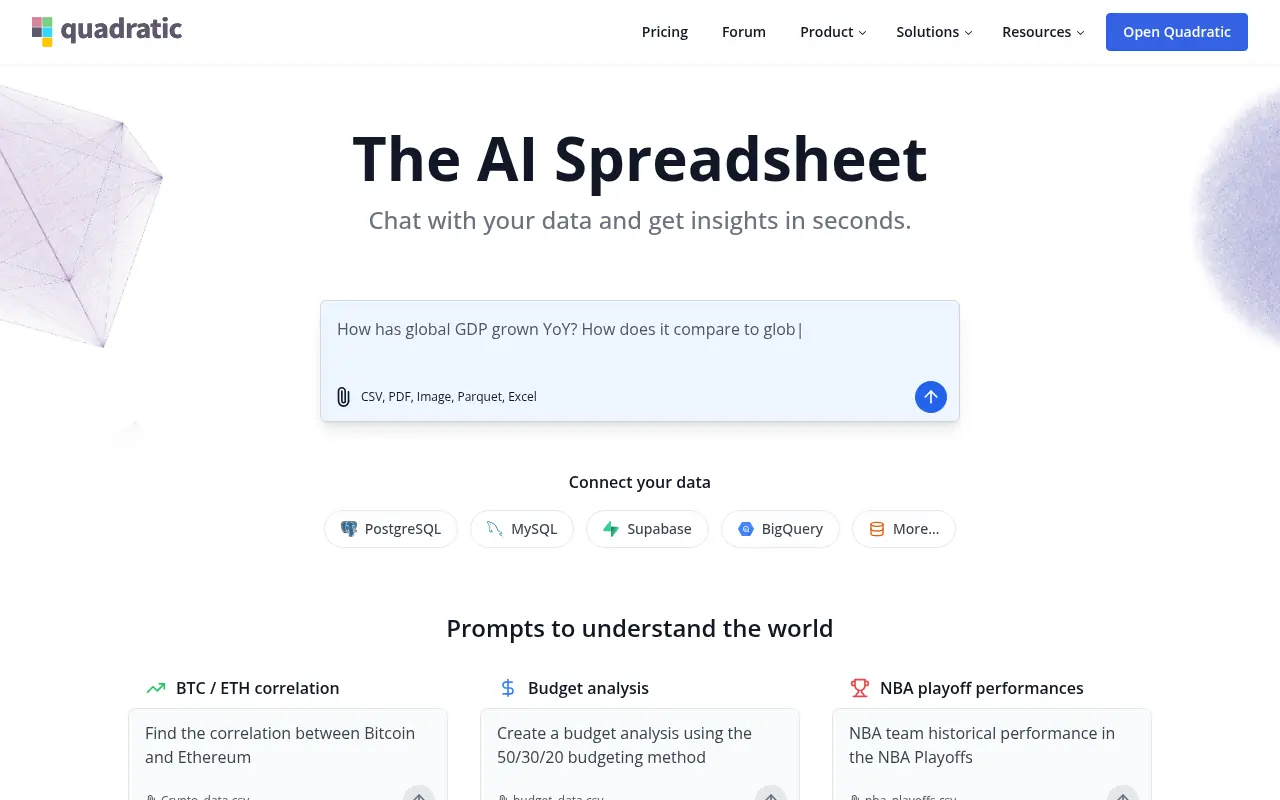
Quadratic
Quadratic is an AI-powered spreadsheet platform that combines infinite canvas spreadsheets with Python, SQL, and AI tools for advanced data analysis and visualization.
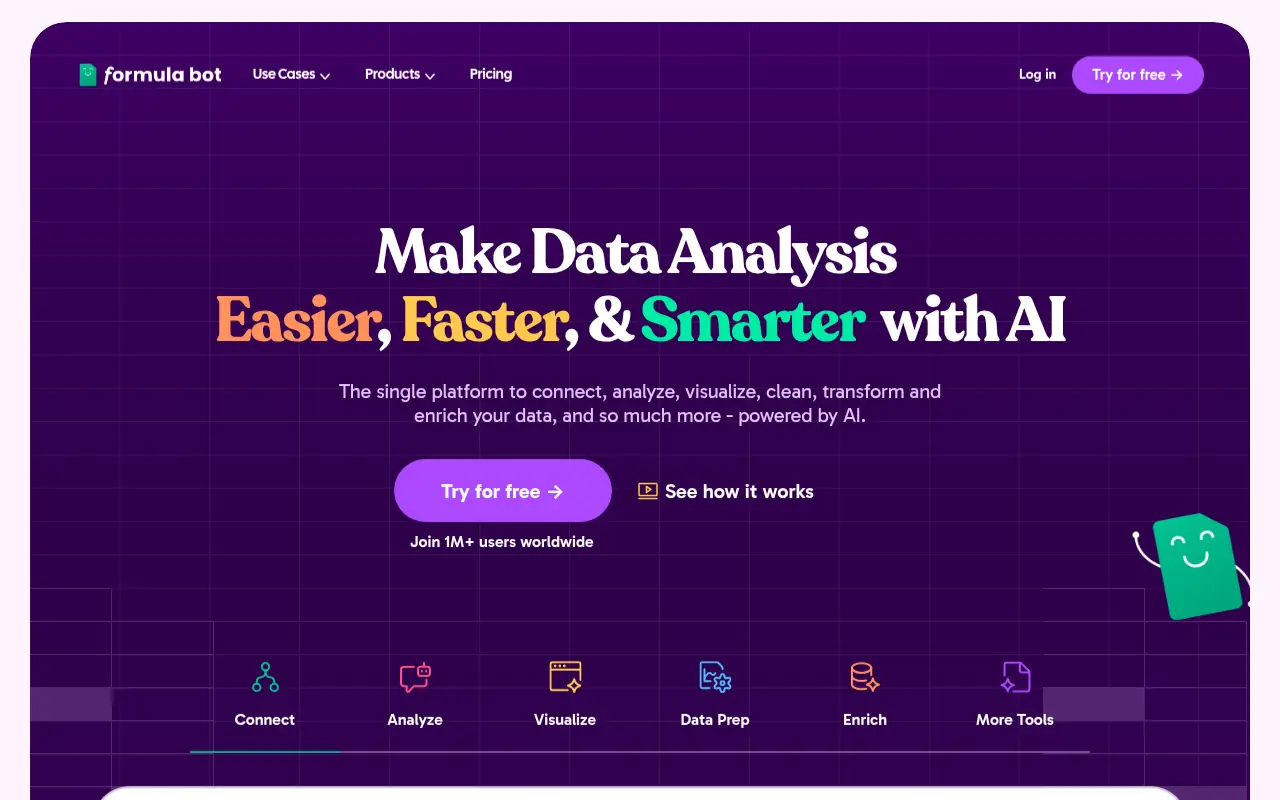
Formula Bot
Formula Bot is an AI-powered platform that simplifies data analysis and spreadsheet tasks by generating formulas, visualizations, and insights from natural language inputs.
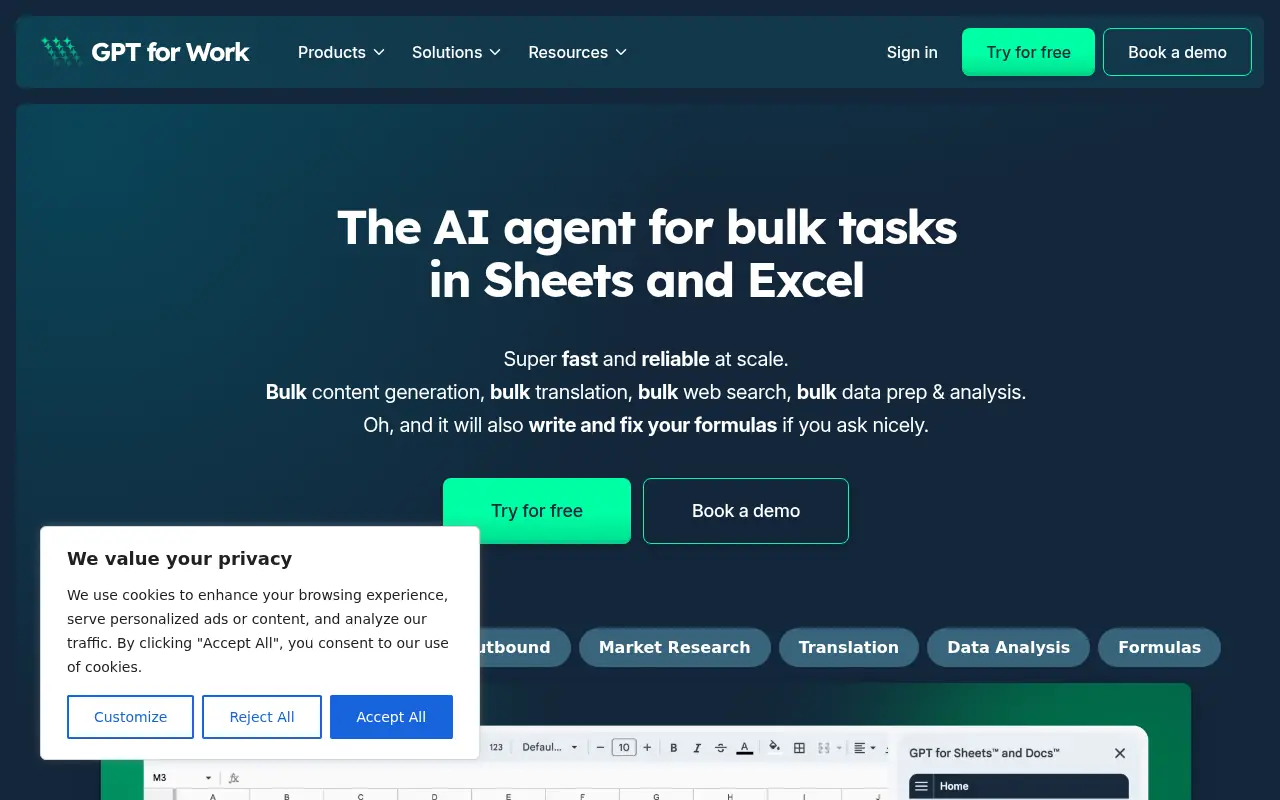
GPT for Work
GPT for Work offers fast, reliable AI-powered automation and content generation for Google Sheets, Docs, Microsoft Excel, and Word.