ChartGen AI
What is ChartGen AI?
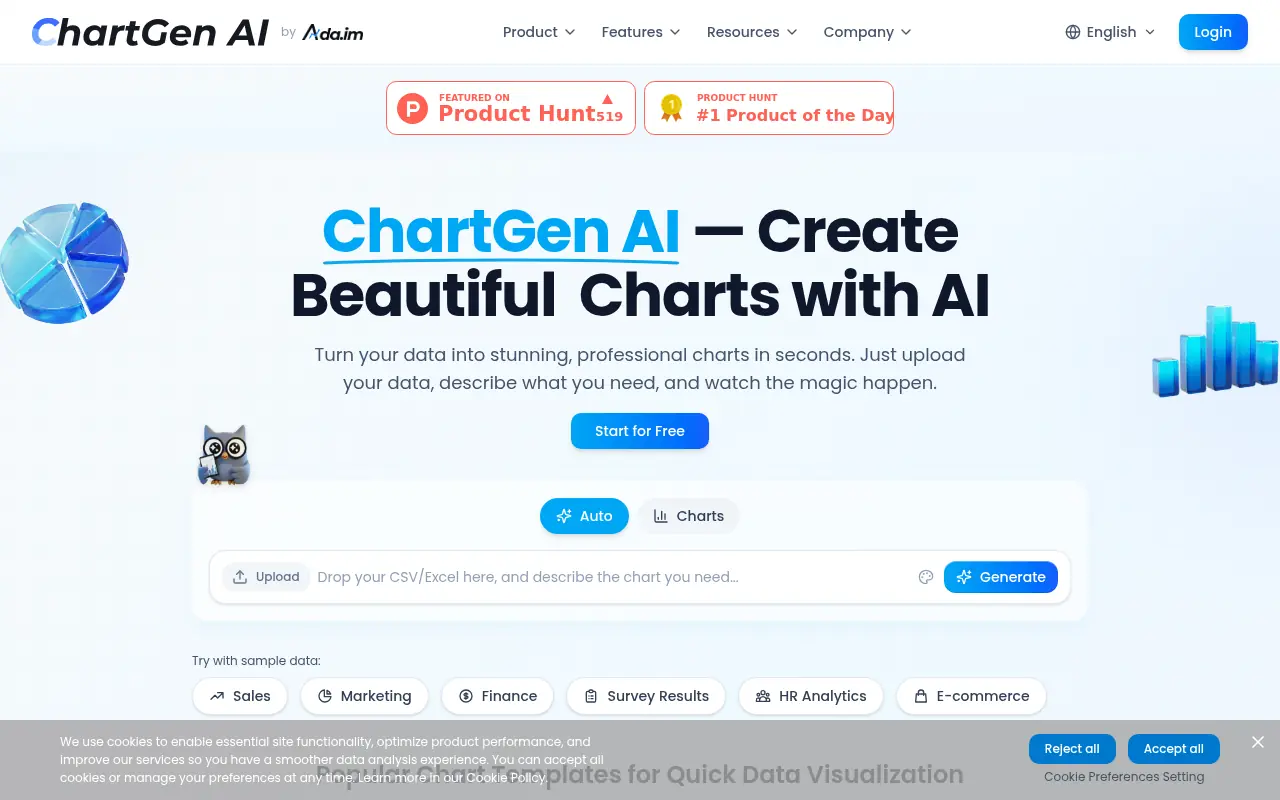
ChartGen AI is a powerful data visualization platform designed to simplify the creation of professional charts. By leveraging artificial intelligence, it allows users to upload raw data files and describe their visualization needs in plain English to generate accurate charts instantly. The tool supports a wide range of chart types and offers customization options to match specific branding or design requirements. It aims to make data analysis accessible to non-technical users, marketers, and business professionals without requiring coding or design skills. Powered by Ada.im, it ensures secure data processing and high-quality outputs suitable for presentations and reports.
How to use ChartGen AI?
To use ChartGen AI, start by uploading your data in CSV, Excel, or JSON format directly to the platform. Next, describe the type of chart you want or the insights you wish to visualize using a simple natural language prompt (e.g., 'Show me a bar chart of sales by month'). The AI will instantly analyze your data and generate the requested chart. You can then refine the result using built-in customization tools to adjust colors, labels, and aggregation methods before exporting the final visual as a PNG, SVG, or other supported formats.
ChartGen AI's Core Features
Generates charts instantly from natural language text descriptions.
Supports 9 professional chart types including Bar, Line, Pie, and Heatmaps.
Seamlessly imports data from CSV, Excel (XLS/XLSX), and JSON files.
Automatically detects data columns and infers correct data types.
Offers 12 professional color themes inspired by top consulting firms.
Allows customization of data aggregation methods like Sum, Average, and Count.
Exports high-resolution charts in PNG, SVG, PDF, and PowerPoint formats.
Ensures enterprise-grade security with SOC 2 compliance and data encryption.
Provides real-time interactive chart editing and customization tools.
Integrates with Ada.im for advanced data analysis and reporting capabilities.
ChartGen AI's Use Cases
- #1
Visualizing marketing campaign performance and ROI.
- #2
Tracking sales trends and monthly revenue growth.
- #3
Creating engaging infographics for social media posts.
- #4
Analyzing financial data like stock prices or profit margins.
- #5
Monitoring website traffic and user engagement metrics.
- #6
Generating professional charts for business presentations.
- #7
Visualizing academic research data and survey results.
- #8
Comparing product performance across different regions.
Frequently Asked Questions
Analytics of ChartGen AI
Monthly Visits Trend: Sep 2025 - May 2026
Traffic Sources
Top Regions
| Region | Traffic Share |
|---|---|
| Russia | 9.78% |
| United States | 9.05% |
| Saudi Arabia | 6.88% |
| India | 5.94% |
| United Kingdom | 3.56% |
Top Keywords
| Keyword | Traffic | CPC |
|---|---|---|
| chartgen ai | 2.1K | $13.43 |
| chartgen | 930 | $10.55 |
| ai图表转换 | -- | -- |
| 热力图 | 1.8K | $5.29 |
| половозрастная пирамида онлайн сделать | -- | -- |
Alternative of ChartGen AI
Graphy
Graphy is an AI-powered tool that allows users to analyze data and create interactive charts, graphs, and dashboards rapidly.
Graph Maker
Graph Maker is an AI-powered web tool that allows users to create professional charts and graphs in seconds, supporting various chart types with easy customization and data import options.

Hint
Hint is an AI-powered platform for personalized astrology insights and horoscope predictions.
Quadratic
Quadratic is an AI-powered spreadsheet platform that combines infinite canvas spreadsheets with Python, SQL, and AI tools for advanced data analysis and visualization.
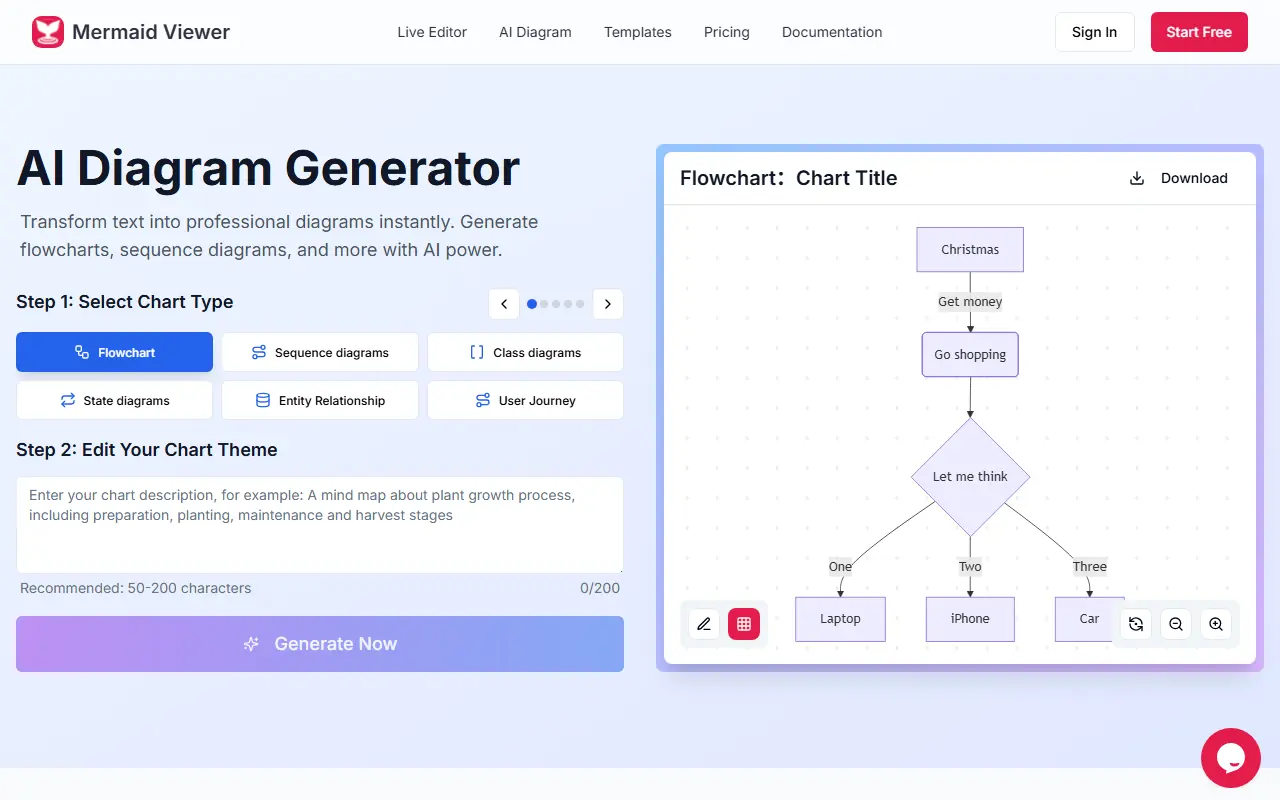
Mermaid Viewer
A browser-based tool that uses AI to transform text descriptions into professional Mermaid diagrams, flowcharts, and charts instantly.
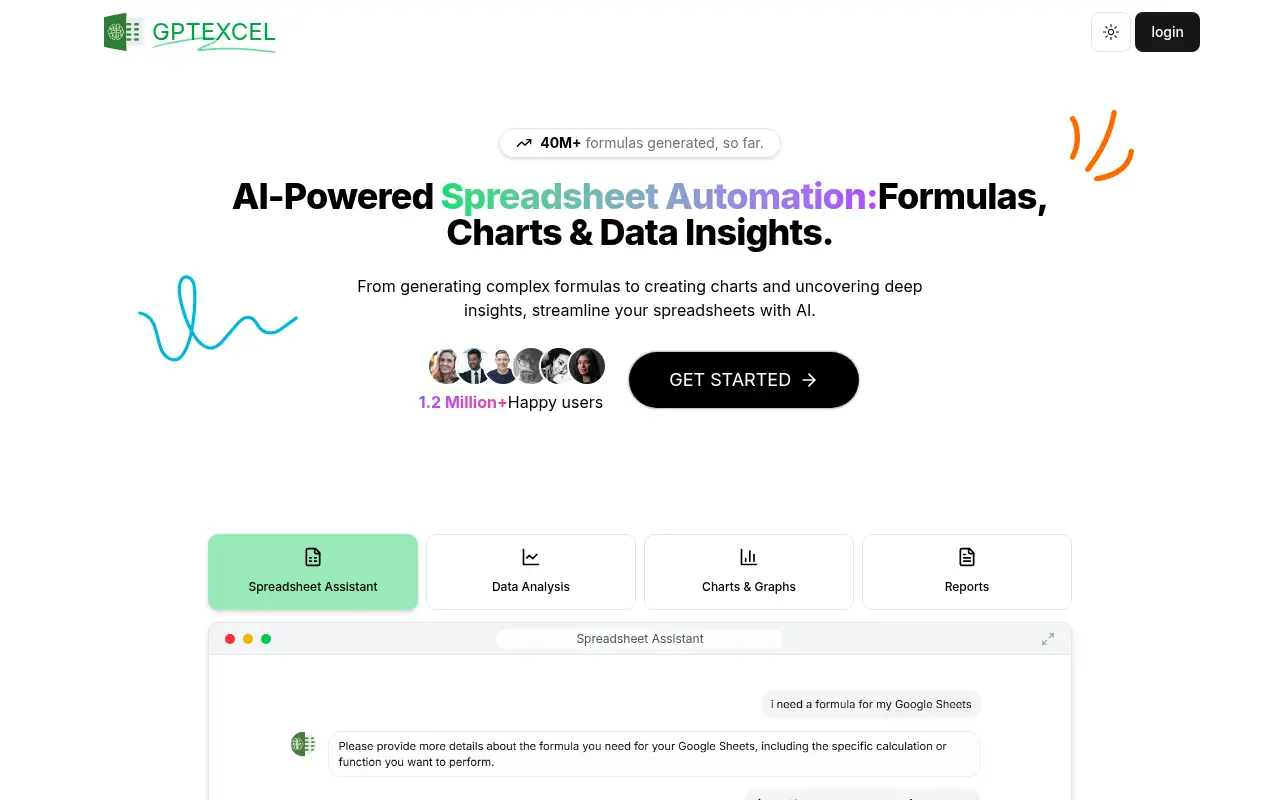
GPTExcel
GPTExcel is an AI-powered tool that simplifies spreadsheet tasks by generating formulas, scripts, and data insights for Excel, Google Sheets, and Airtable.
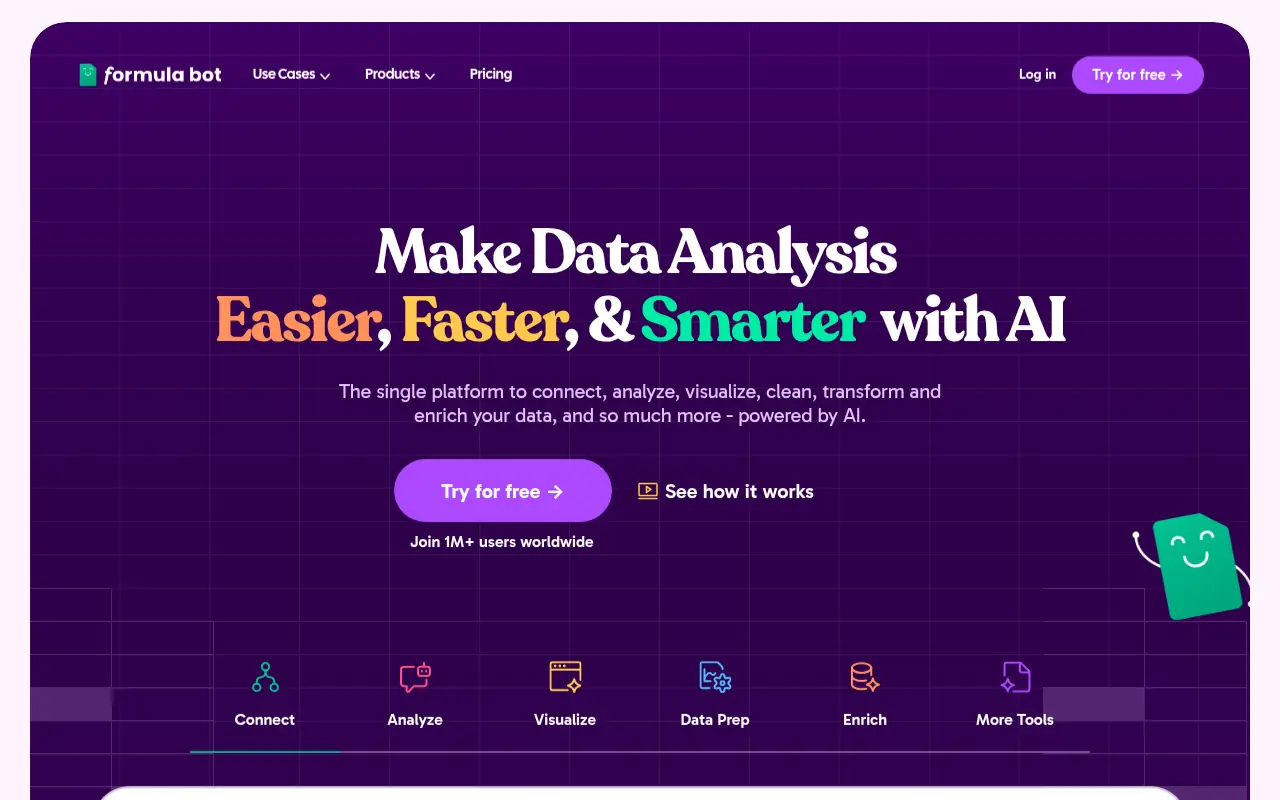
Formula Bot
Formula Bot is an AI-powered platform that simplifies data analysis and spreadsheet tasks by generating formulas, visualizations, and insights from natural language inputs.
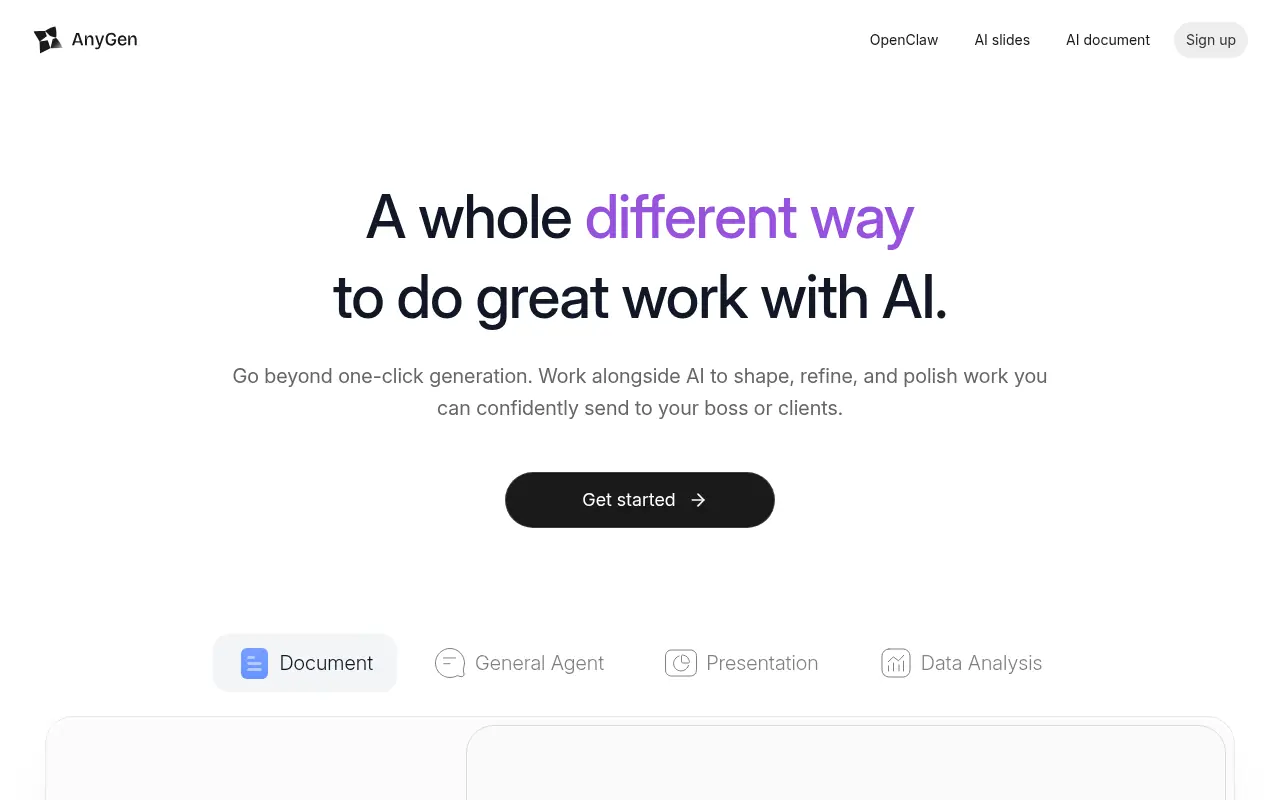
AnyGen
AnyGen is an AI-powered productivity workspace designed to help professionals collaboratively write documents, analyze data, and build seamless presentations.