Bricks
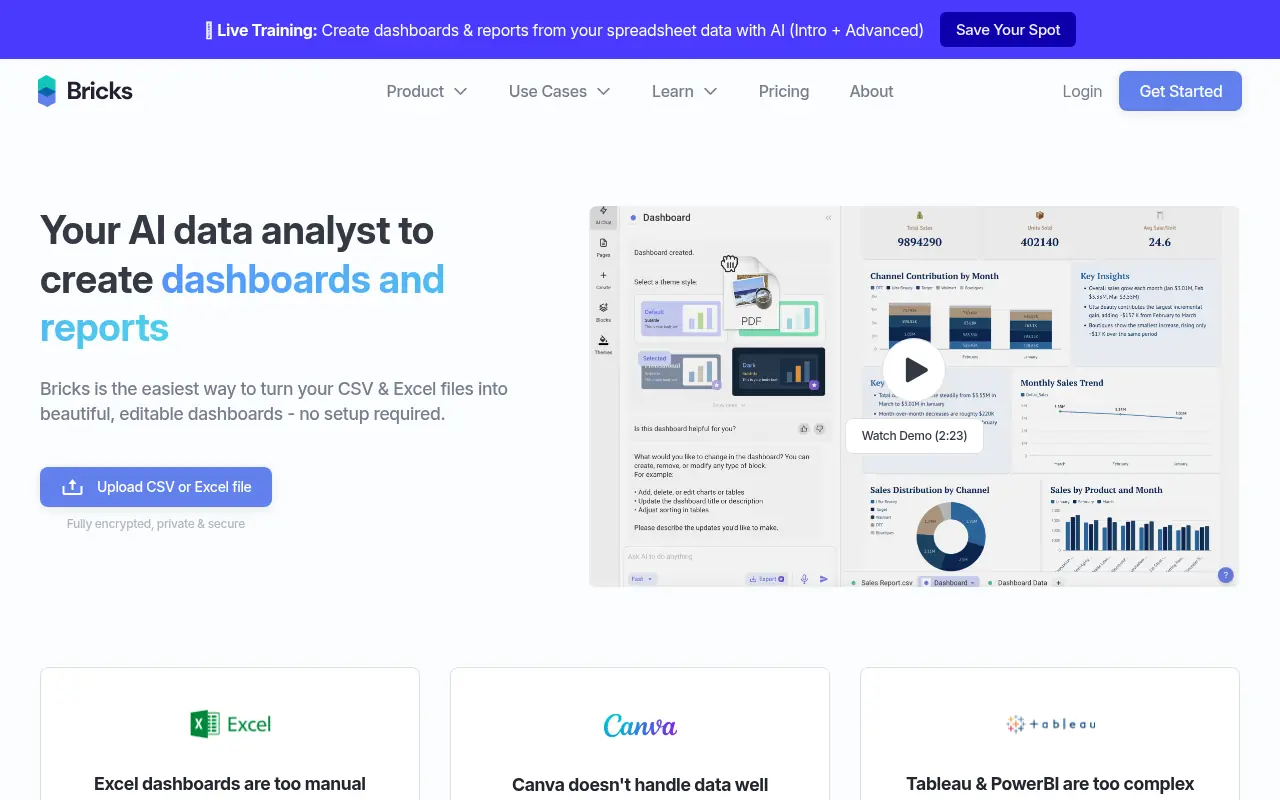
What is Bricks?
Bricks is a comprehensive data analysis and business intelligence tool that simplifies the creation of dashboards, reports, and presentations through AI-powered automation. The platform allows users to import data from various sources including PDFs, images, Excel files, and CSV documents, then describe their desired outputs in plain language to generate professional visualizations. Bricks eliminates the need for manual data formatting and complex chart building by leveraging artificial intelligence to instantly create interactive dashboards, slide decks, and business reports. The tool is designed for executives, teams, and professionals who need to quickly transform raw data into actionable insights and polished presentations without requiring technical expertise or data science knowledge.
How to use Bricks?
To use Bricks, start by importing your data from supported formats such as PDF, images, Excel, or CSV files into the platform. Once your data is loaded, simply describe what you want to create using natural language commands, and Bricks' AI will automatically generate interactive dashboards, charts, or presentation slides based on your requirements. You can customize the output by selecting different chart types, themes, and layouts through the chart composer tool. When satisfied with your creation, export your work as PDF, PPTX files, generate shareable web links, or present directly within the Bricks application for team meetings and executive summaries.
Bricks's Core Features
AI-powered slide creation that transforms raw data into presentation slides using natural language commands.
Dynamic dashboards and reports that update automatically as underlying data changes in real-time.
Support for multiple data import formats including PDF, images, Excel, and CSV files.
Powerful chart composer with bar charts, line charts, pie charts, and ready-made templates for various business needs.
Export capabilities to PDF, PPTX formats, shareable web links, or direct presentation within the app.
Customizable themes and branding options to match company style guidelines.
Natural language interface for describing desired visualizations without technical knowledge.
Interactive dashboards with filtering and sorting capabilities for deeper data exploration.
Pre-built templates designed specifically for sales, marketing, and project reporting use cases.
Visual board creation tools for comprehensive data storytelling and analysis.
Bricks's Use Cases
- #1
Creating executive summary dashboards that update in real-time as data changes
- #2
Generating sales decks and investor presentations from raw business data
- #3
Building interactive performance tracking reports for team metrics
- #4
Designing professional business reports tailored for executives without manual formatting
- #5
Creating project status reports with customized visualizations and branding
- #6
Developing marketing analytics dashboards with various chart types
- #7
Producing quarterly business reviews with automated data-driven slides
- #8
Building custom reports for different departments using faceted data filtering
Frequently Asked Questions
Analytics of Bricks
Monthly Visits Trend: Jun 2025 - May 2026
Traffic Sources
AI Channel Traffic Trends
Top Regions
| Region | Traffic Share |
|---|---|
| United States | 24.75% |
| Canada | 9.33% |
| India | 5.52% |
| United Kingdom | 4.86% |
| Vietnam | 3.56% |
Top Keywords
| Keyword | Traffic | CPC |
|---|---|---|
| bricks ai | 2.5K | $3.70 |
| bricks | 80.0K | $1.00 |
| remove extra enters in cell excel | -- | -- |
| thebricks | 770 | $0.45 |
| portrait spreadsheet | -- | -- |
Alternative of Bricks

Tableau
Tableau is a powerful visual analytics platform that empowers individuals and organizations to explore, analyze, and securely share actionable data insights.
Julius AI
Julius AI is an AI-powered platform for data analysis, visualization, and statistical modeling.

Astra AI
Astra AI is a cutting-edge platform that harnesses artificial intelligence to provide advanced data analysis and business intelligence solutions.
Qlik
Qlik is a leading business intelligence platform that enables data visualization, analytics, and AI-driven insights to help organizations make data-informed decisions.
Kaggle
Kaggle is a global platform for data science and machine learning, offering competitions, datasets, and collaborative tools for professionals and learners.
Snowflake
Snowflake is a cloud-based data platform that enables scalable data storage, analytics, and AI-driven insights for enterprises.
Feedly
Feedly is a news aggregator that curates personalized content feeds for individuals and teams to stay informed on topics that matter.

ChatPDF
ChatPDF enables users to interact with PDF documents through AI-powered conversations and analysis.