Venngage
What is Venngage?
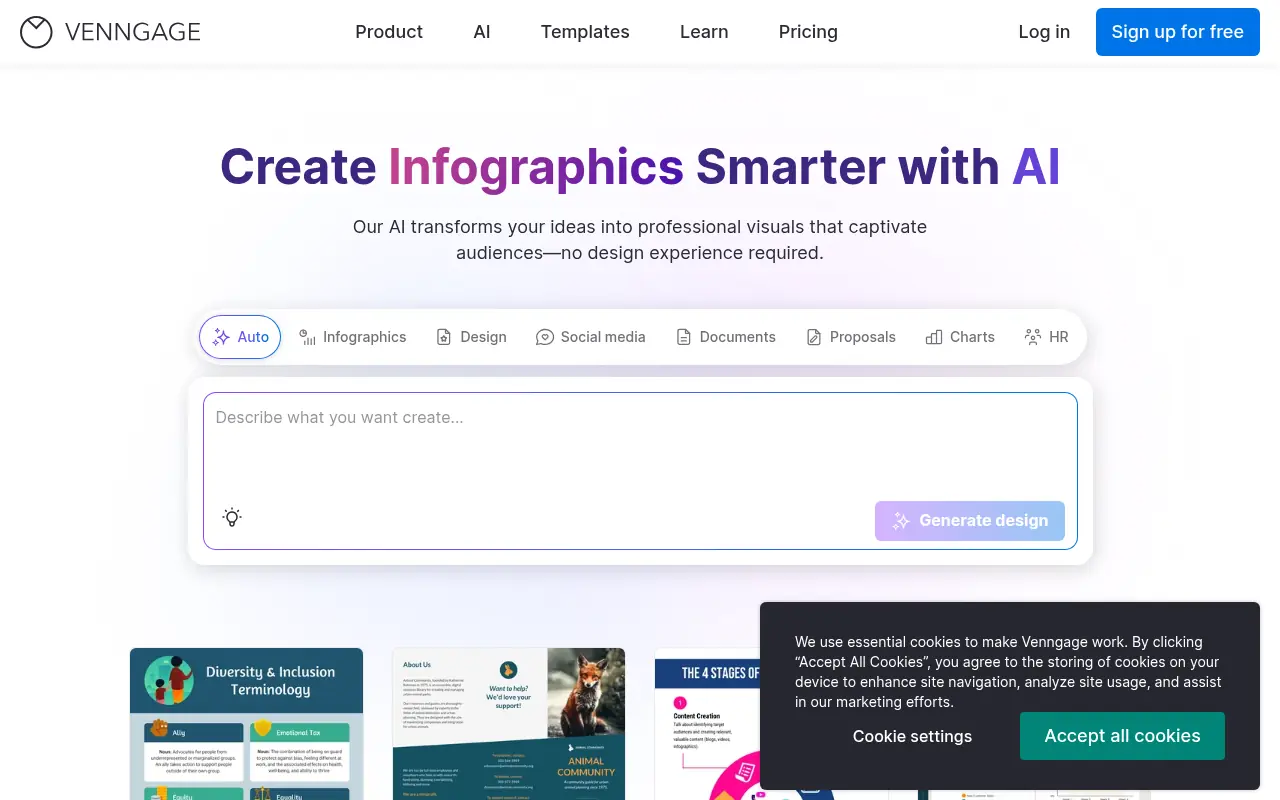
Venngage is a user-friendly online design tool specializing in the creation of infographics, charts, maps, reports, and presentations, aimed at making visual communication accessible to non-designers. Founded with the mission to democratize data visualization, it helps businesses, educators, and marketers convey complex information in an engaging, easy-to-understand format. The platform integrates AI features to automate design suggestions, generate content ideas, and optimize layouts, solving the problem of time-consuming manual design work. Users can start with customizable templates and drag-and-drop elements to build visuals quickly. It serves a wide range of industries by providing tools for data-driven storytelling, enhancing reports and marketing materials. Overall, Venngage empowers users to produce high-quality visuals that improve audience engagement and information retention.
Venngage's Core Features
AI Design Generator automatically creates infographic layouts based on user input, saving time and ensuring professional results.
Thousands of customizable templates for infographics, presentations, and reports allow users to start projects quickly without design expertise.
Drag-and-drop editor enables easy addition of charts, icons, images, and text to create visually appealing content.
Data visualization tools like charts and maps help users transform raw data into interactive, understandable graphics.
Collaboration features allow teams to work together in real-time, providing feedback and edits on shared projects.
Export options in various formats such as PDF, PNG, and interactive HTML ensure versatility for different use cases.
Brand kit integration lets users maintain consistent branding with custom colors, fonts, and logos across designs.
Accessibility checker ensures designs meet standards for color contrast and readability, promoting inclusive content.
AI-powered content suggestions generate text and layout ideas based on the topic, enhancing creativity.
Integration with tools like Google Sheets and Excel for seamless data import and real-time updates.
Stock photo and icon library provides millions of assets to enhance visuals without external sourcing.
Presentation mode turns designs into interactive slideshows for engaging meetings and webinars.
Analytics tracking on shared visuals helps users understand viewer engagement and interaction.
Frequently Asked Questions
Analytics of Venngage
Monthly Visits Trend
Traffic Sources
Top Regions
| Region | Traffic Share |
|---|---|
| United States | 19.07% |
| India | 10.67% |
| Brazil | 5.14% |
| Mexico | 4.44% |
| Philippines | 3.59% |
Top Keywords
| Keyword | Traffic | CPC |
|---|---|---|
| venngage | 24.5K | $1.74 |
| infografia | 159.4K | $0.38 |
| infographic | 229.7K | $0.75 |
| venngage ai | 3.5K | $0.42 |
| infographic template | 15.6K | $0.99 |

