Piktochart
What is Piktochart?
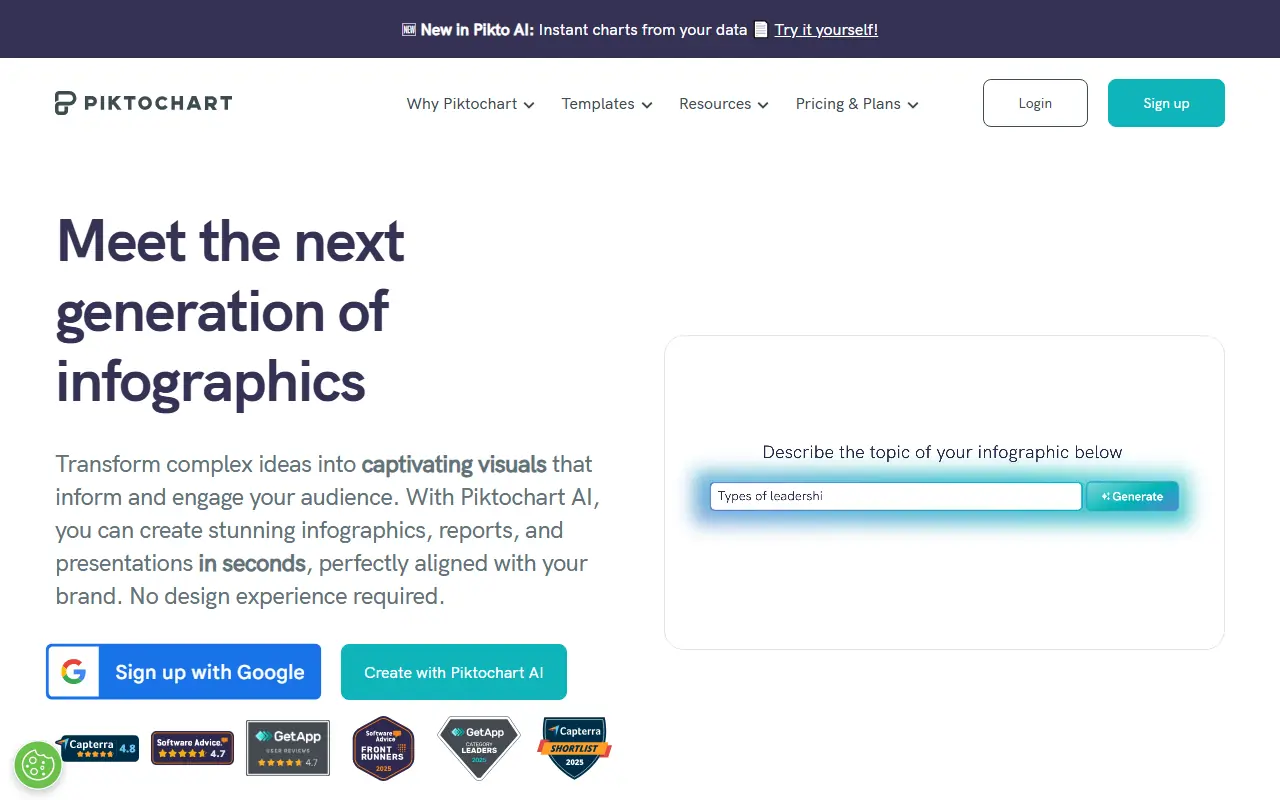
Piktochart is a web-based graphic design and visual storytelling tool launched in 2012, designed to empower users to create professional infographics, presentations, reports, posters, and social media graphics without requiring design expertise. Its mission is to simplify visual communication, enabling individuals, businesses, and educators to transform complex data into engaging, accessible visuals. The platform offers an intuitive drag-and-drop editor, a vast library of templates, and AI-driven features to streamline the design process. Piktochart serves a diverse user base, including small businesses, nonprofits, educators, and marketers, helping them convey messages effectively through visually appealing content. With over 14 million users worldwide, it supports collaborative workflows and brand consistency, making it a go-to solution for creating impactful visual stories.
Piktochart's Core Features
Piktochart AI generates professional infographics, posters, and reports from text prompts in seconds, saving users time and effort.
The drag-and-drop editor allows users to customize templates easily, making design accessible to non-designers.
A library of over 600 templates ensures users can create on-brand visuals for various formats like presentations, banners, and social media graphics.
Brand Assets feature centralizes logos, fonts, and colors, ensuring consistent branding across all designs.
Collaborative tools enable team members to comment, edit, and review visuals in real-time, similar to Google Docs or Microsoft Teams.
Piktochart Video allows users to record, transcribe, and repurpose video content for social media with automatic captions in over 60 languages.
Interactive charts and maps visualize data dynamically, enhancing presentations and reports with clear, engaging graphics.
CSV and Google Sheets integration enables users to import data seamlessly for quick chart creation.
Password protection and visual permissions provide secure sharing and controlled access to published visuals.
High-quality download options, including PNGs with transparent backgrounds, cater to professional printing and digital use.
Frequently Asked Questions
Analytics of Piktochart
Monthly Visits Trend
Traffic Sources
Top Regions
| Region | Traffic Share |
|---|---|
| United States | 14.50% |
| India | 7.63% |
| Mexico | 6.86% |
| Colombia | 6.13% |
| Brazil | 4.93% |
Top Keywords
| Keyword | Traffic | CPC |
|---|---|---|
| piktochart | 38.1K | $0.44 |
| piktochart ai | 12.9K | $1.48 |
| pictochart | 1.9K | $0.97 |
| ias para hacer infografias | -- | -- |
| ia pour synthese de document avec shemas | 1.1K | -- |
Alternative of Piktochart
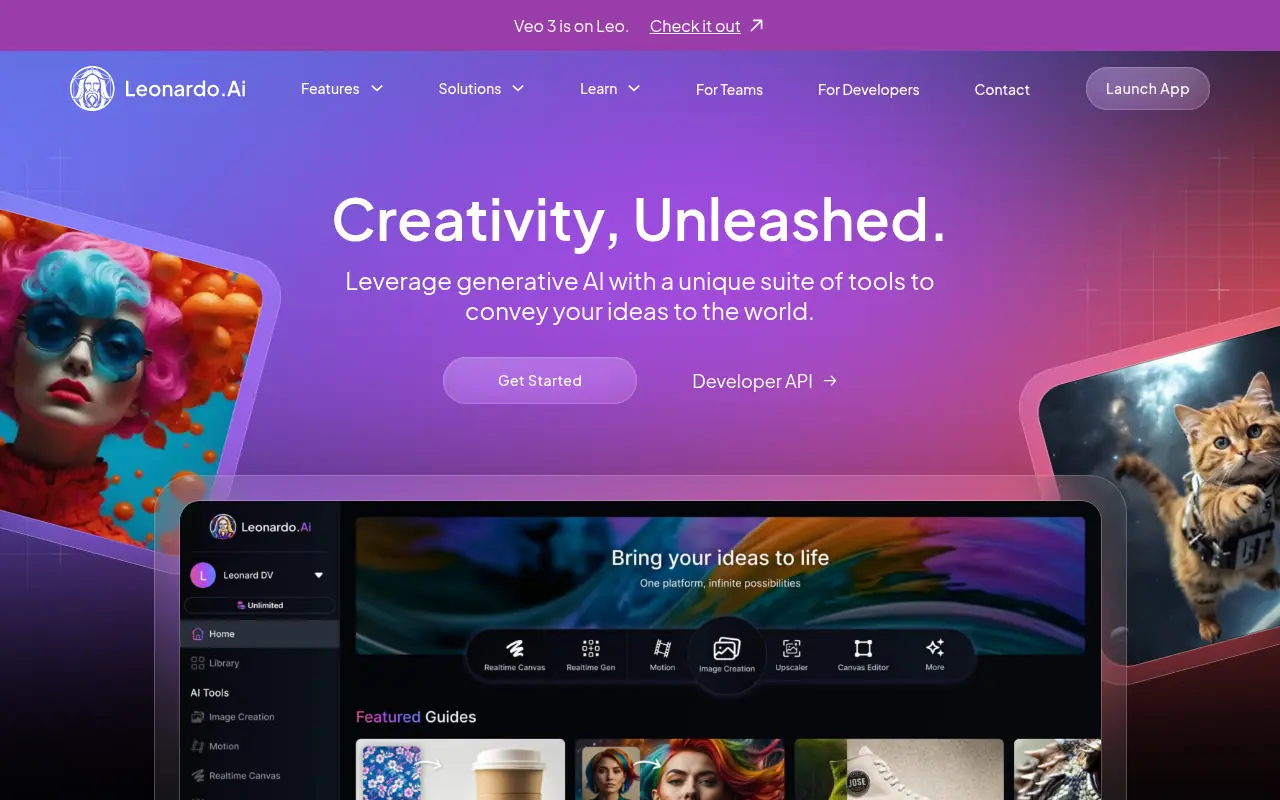
Leonardo.Ai
Leonardo.Ai is an AI-driven platform for generating high-quality visual assets for creative projects.
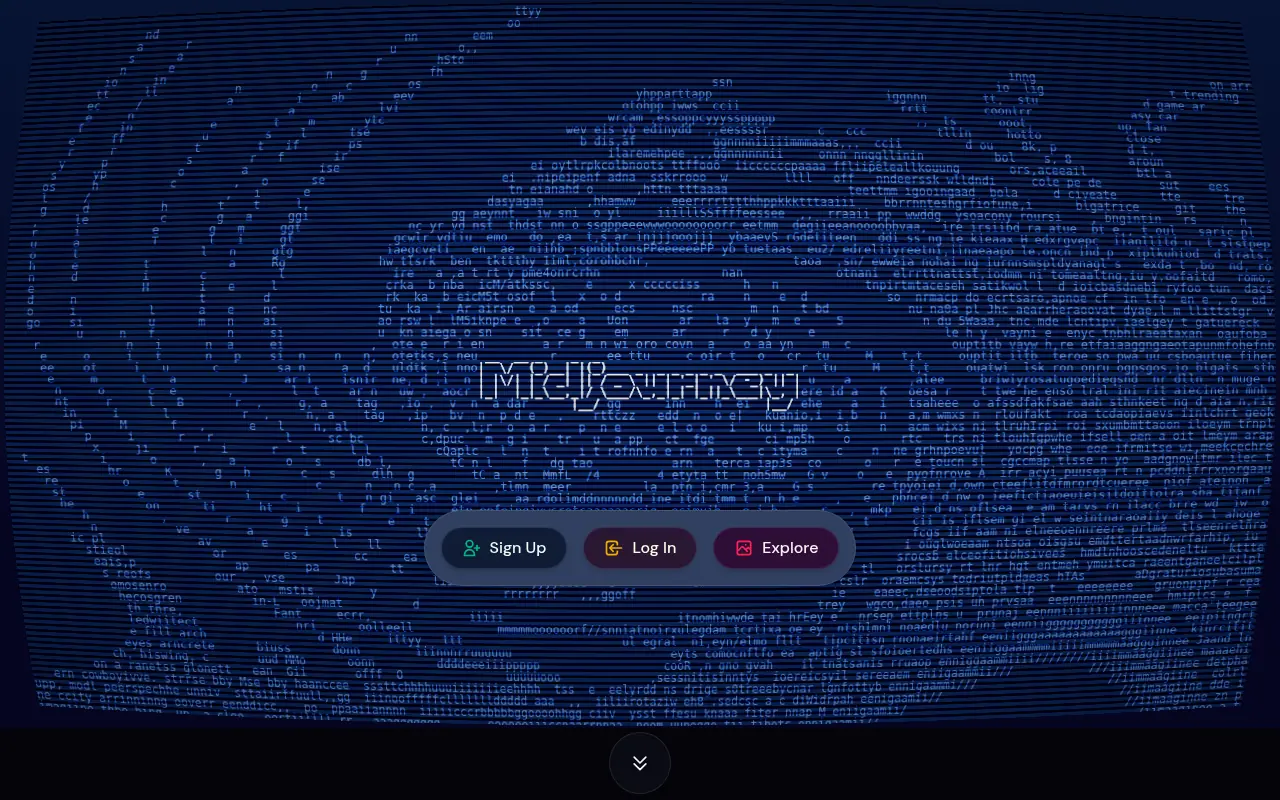
Midjourney
Midjourney is an AI-powered platform for generating stunning images from text prompts.
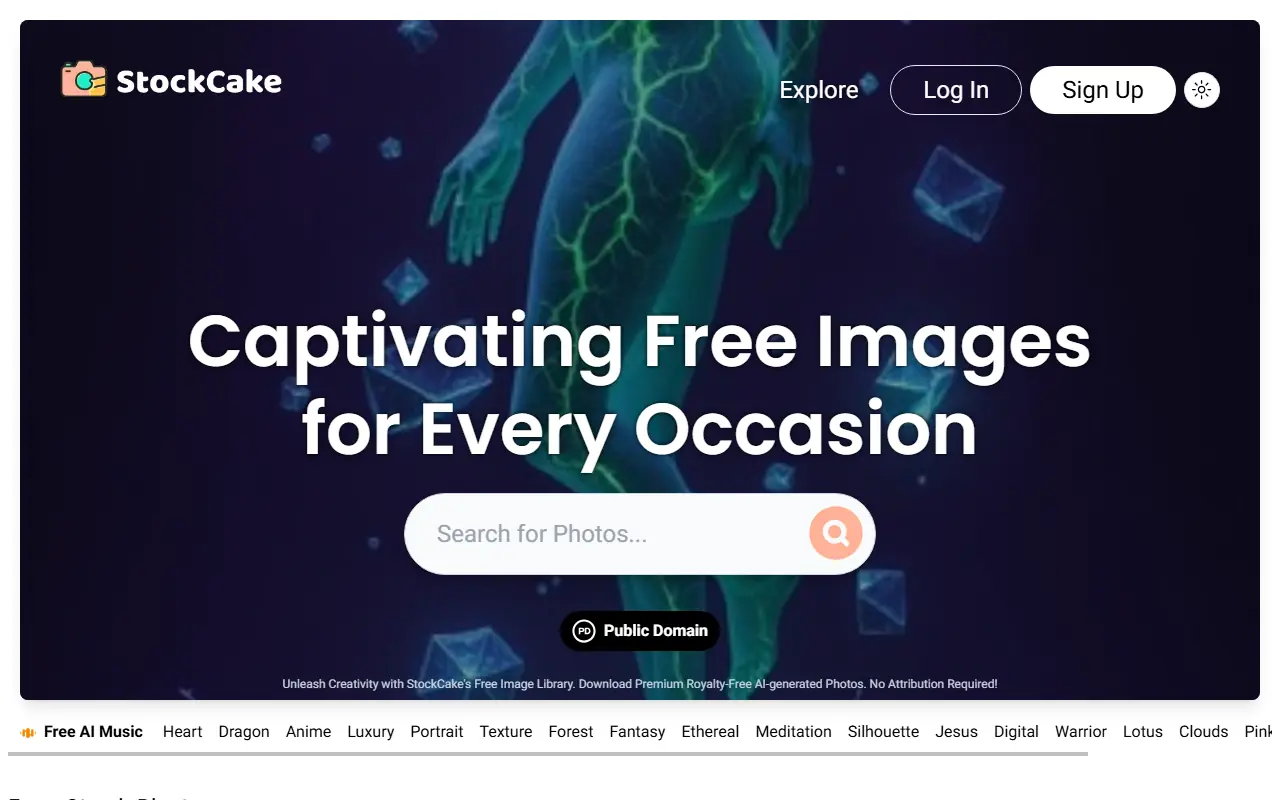
StockCake
StockCake provides a vast library of high-quality, AI-generated stock photos for free commercial and personal use.
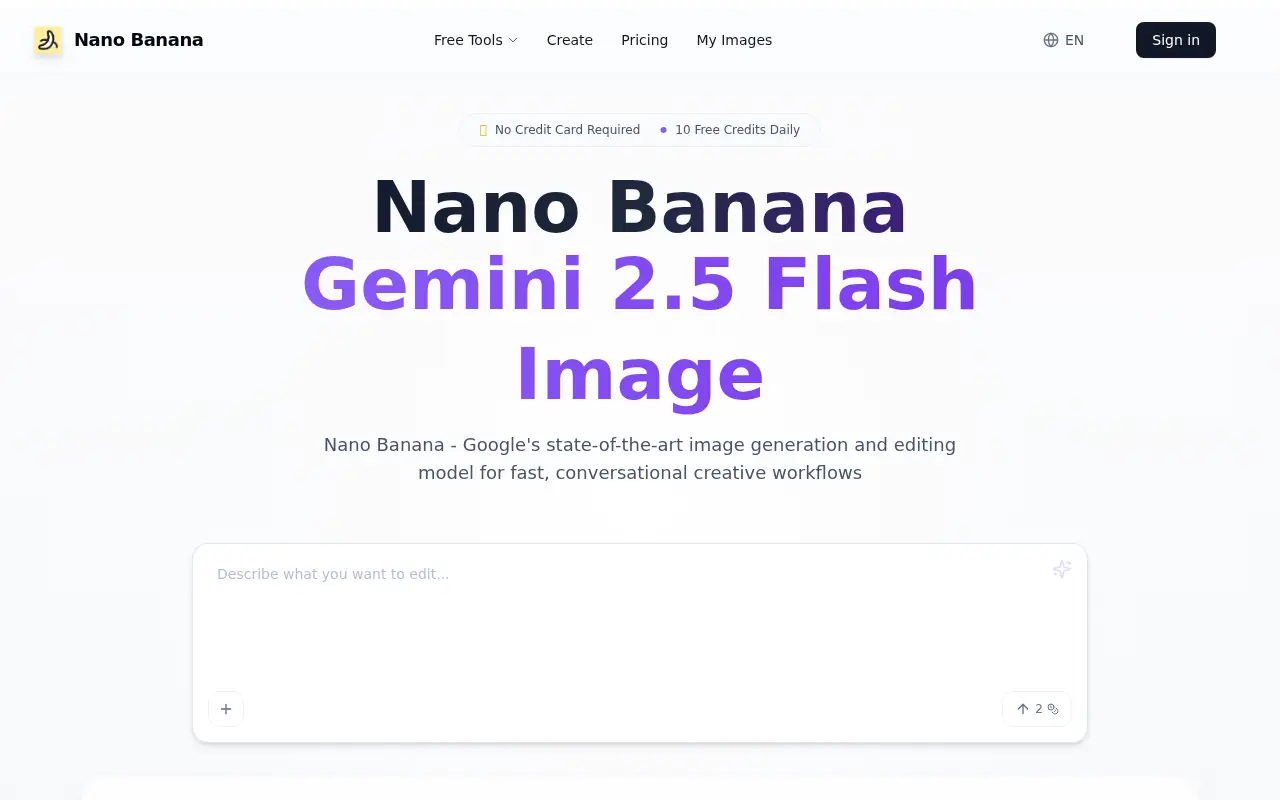
Nano Banana
Nano Banana is an AI-powered image generation and editing platform using Google's Gemini 2.5 Flash Image technology for fast, conversational creative workflows.
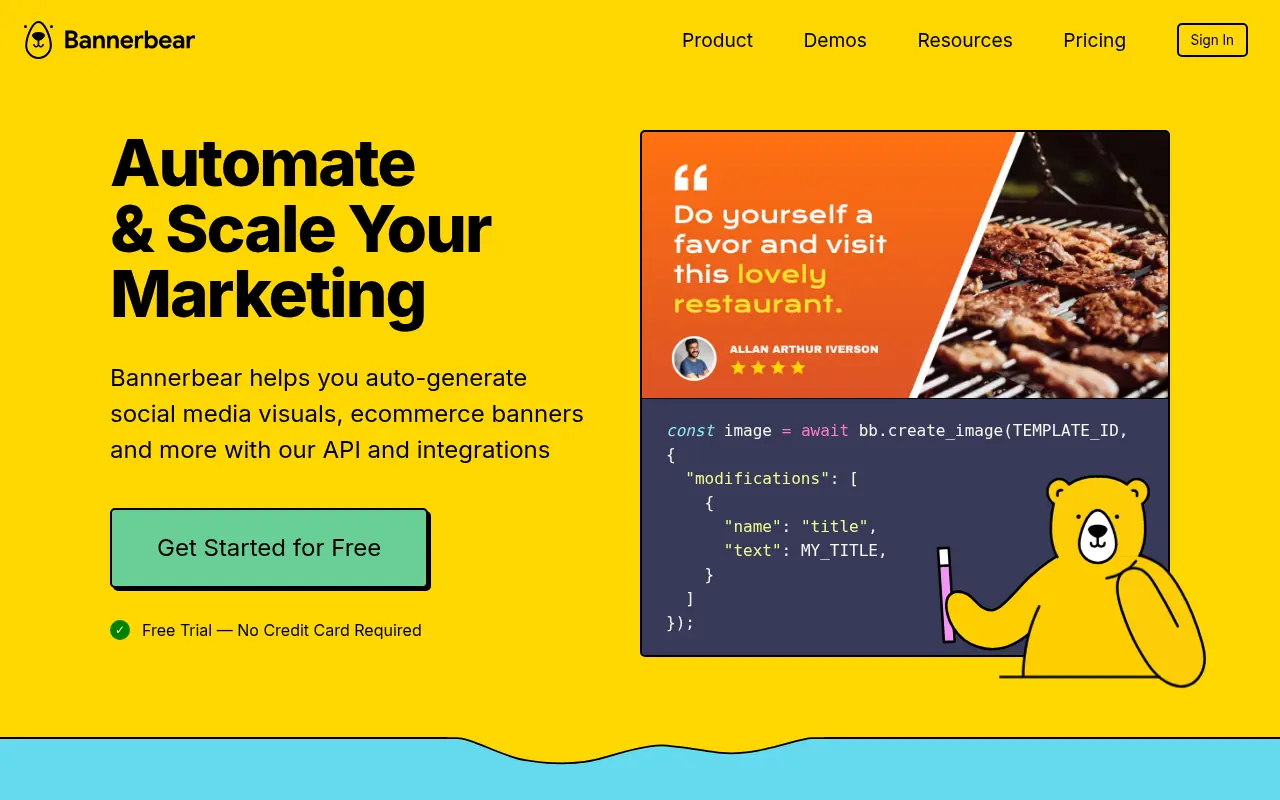
BannerBear
BannerBear is an API-based platform that automates the generation of customized images and videos for marketing, e-commerce, and social media purposes.
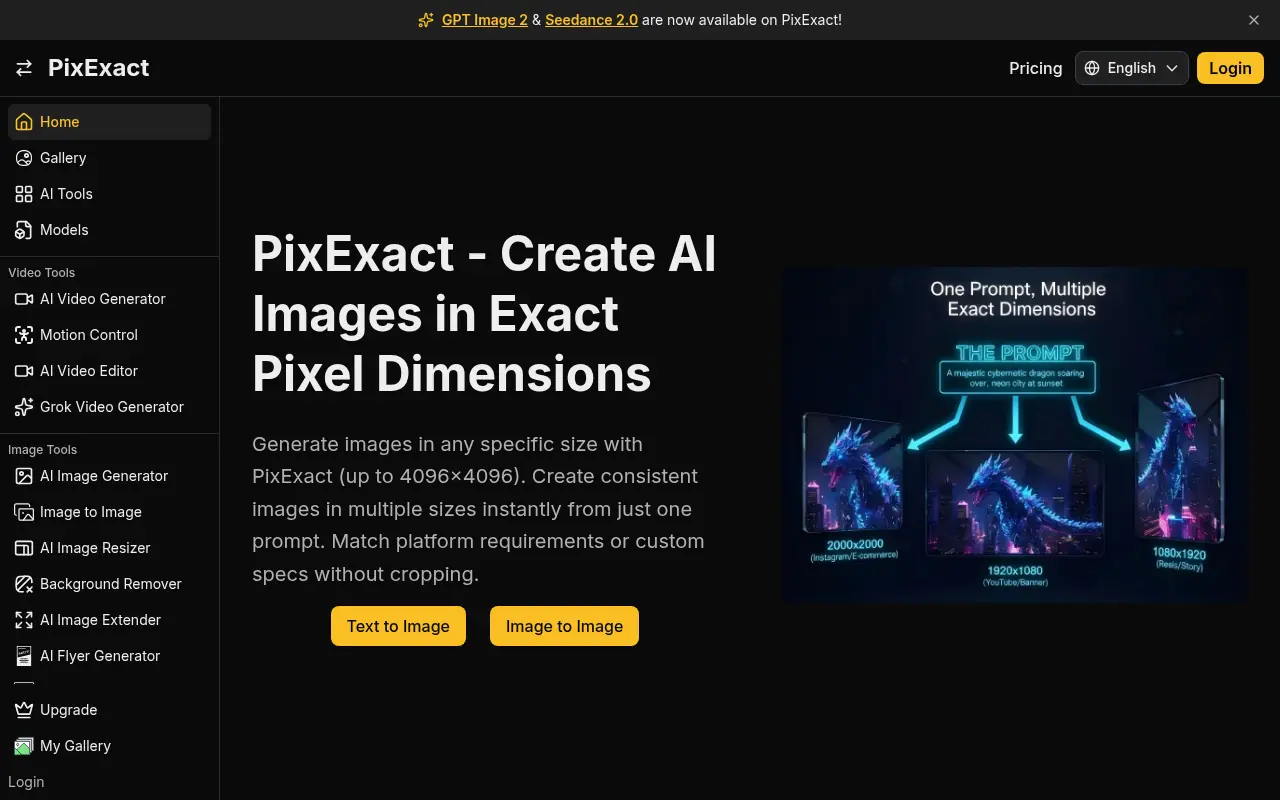
PixExact
PixExact is an AI image generation and editing platform that allows users to create consistent multi-size visual assets in exact pixel dimensions from a single prompt.
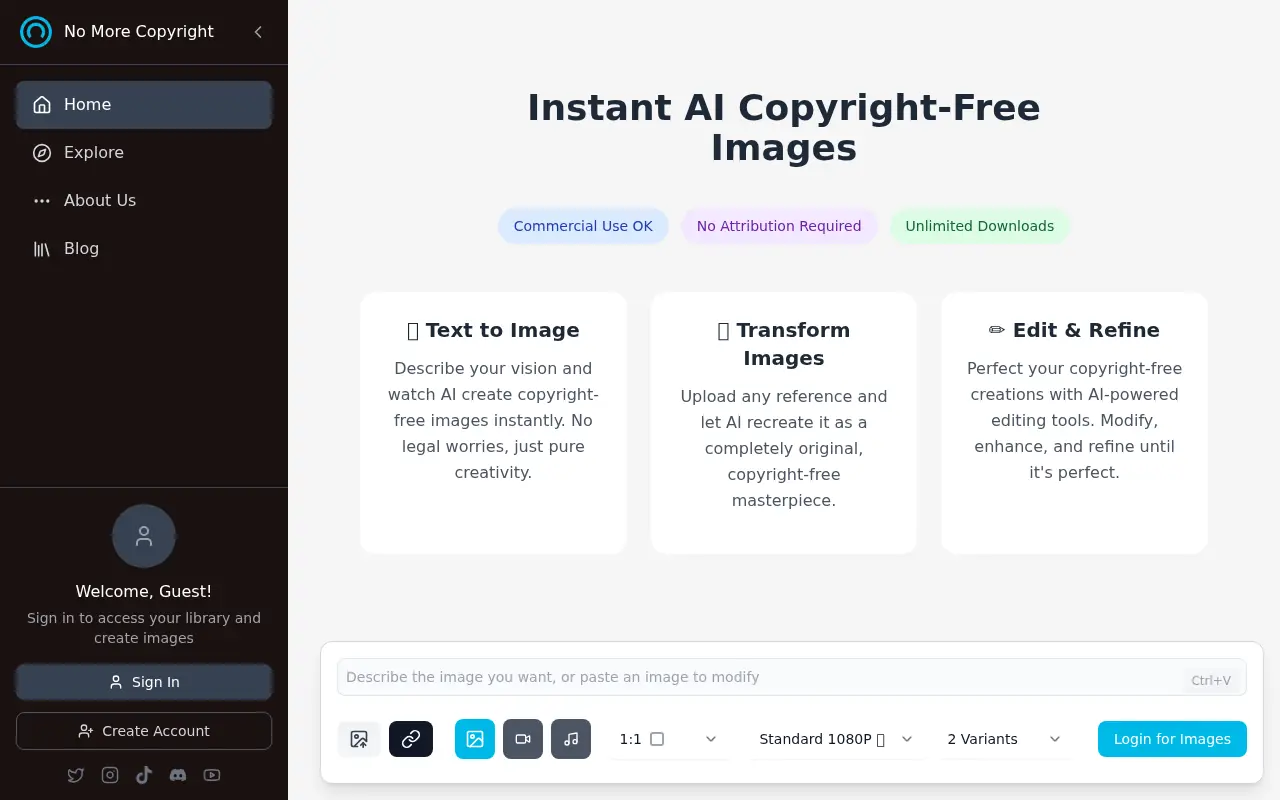
No More Copyright
No More Copyright is an AI-driven platform that transforms uploaded images into unique, copyright-free visuals for both personal and commercial use.
Freepik
Freepik is an AI-powered creative suite offering stock assets and tools for designers.