Syft Analytics
What is Syft Analytics?
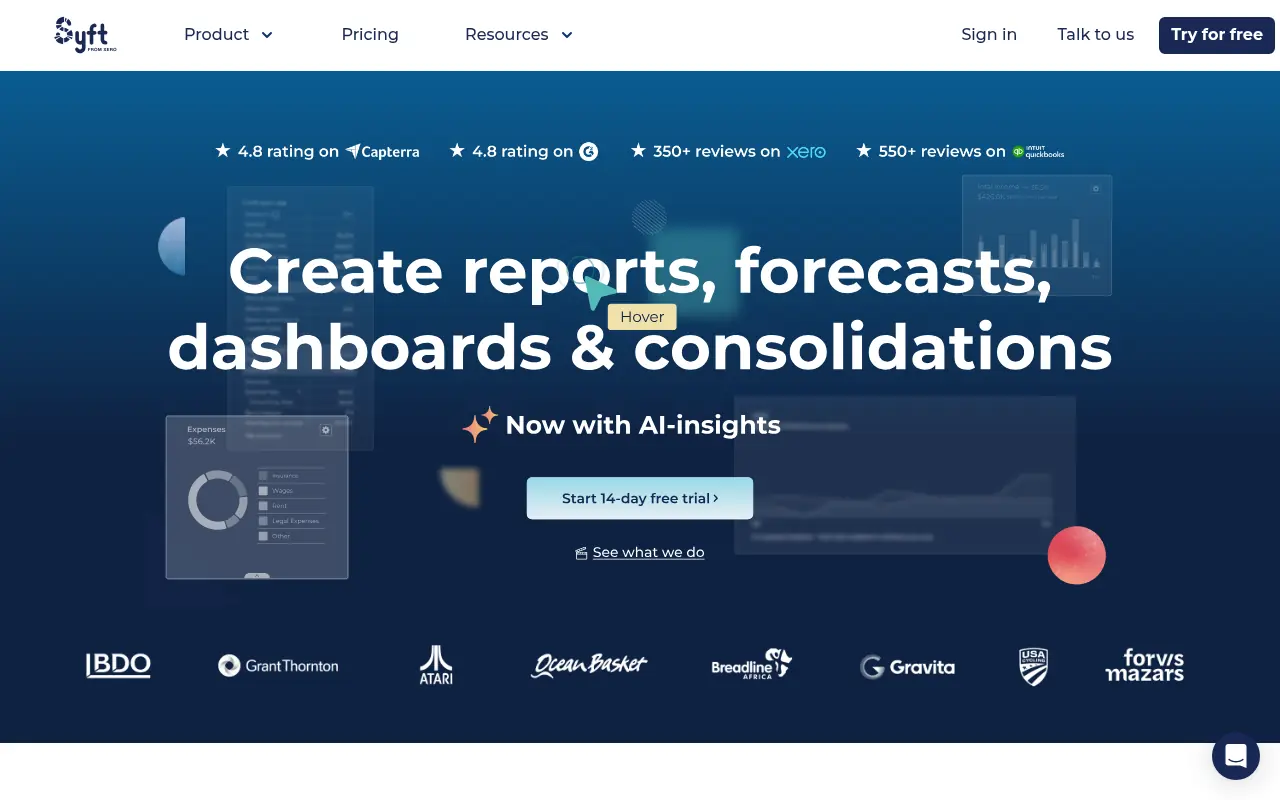
Syft Analytics is a comprehensive financial reporting and data visualization platform designed for businesses, accountants, and bookkeepers. Its mission is to make complex financial data accessible and understandable, enabling better decision-making for organizations of all sizes. By integrating directly with popular accounting software like Xero, QuickBooks, and Sage, it automates the creation of professional reports, dashboards, and forecasts. It solves the problem of manual, time-consuming spreadsheet work by offering a centralized hub for multi-entity consolidations, AI-generated financial commentary, and real-time performance tracking.
How to use Syft Analytics?
To use Syft Analytics effectively, start by creating an account and integrating it with your primary accounting or e-commerce software. Once your data syncs, navigate to the dashboard to visualize your financial metrics using customizable graphs and KPI cards. You can then use the report builder to generate automated, branded financial reports, or access the forecasting tools to model future cash flows and budgets. Finally, share these live dashboards and reports securely with clients, stakeholders, or team members to facilitate collaborative financial reviews.
Syft Analytics's Core Features
Financial Reporting: Create customized, branded, and interactive financial reports effortlessly.
Dashboards: Visualize business performance in real-time with highly customizable graphs and KPI cards.
Consolidations: Combine financial data from multiple entities and currencies into one clear view.
Forecasting: Manage cash flow and build complex budgets utilizing powerful predictive analytics.
AI Insights: Generate automated commentary and actionable suggestions to improve key performance indicators.
Spreadsheet Link: Connect live financial data directly to Excel or Google Sheets for custom manipulation.
Benchmarking: Compare your operational and financial performance against specific industry standards.
Seamless Integrations: Sync automatically with platforms like Xero, QuickBooks, Sage, Stripe, and Shopify.
Syft Analytics's Use Cases
- #1
Automating the creation of professional, customized financial reports for board meetings or clients.
- #2
Consolidating financial data from multiple entities and currencies into a single, unified view.
- #3
Forecasting cash flow and building predictive financial models up to 10 years in advance.
- #4
Benchmarking company performance against industry standards to identify growth opportunities.
- #5
Transforming complex accounting data into easy-to-understand visual dashboards for non-financial stakeholders.
Frequently Asked Questions
Analytics of Syft Analytics
Monthly Visits Trend
Traffic Sources
Top Regions
| Region | Traffic Share |
|---|---|
| Australia | 49.97% |
| United Kingdom | 26.27% |
| New Zealand | 6.47% |
| United States | 6.24% |
| South Africa | 4.75% |
Top Keywords
| Keyword | Traffic | CPC |
|---|---|---|
| syft | 5.8K | $5.00 |
| syft analytics | 1.3K | $9.52 |
| syft login | 710 | -- |
| syft analytics gtm | 150 | -- |
| syftanalytics sales team | 140 | -- |
Alternative of Syft Analytics
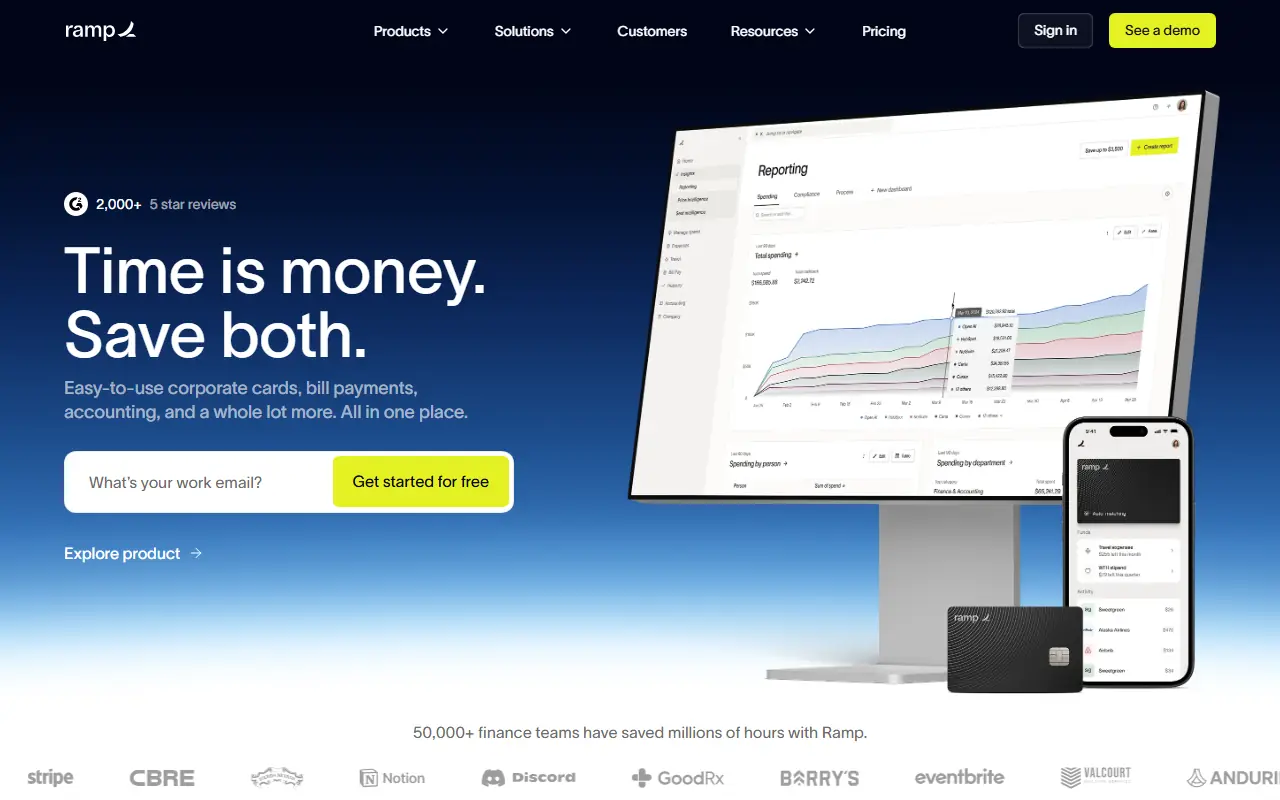
Ramp
Ramp is an all-in-one finance automation platform designed to save businesses time and money through corporate cards, expense management, and accounting automation.
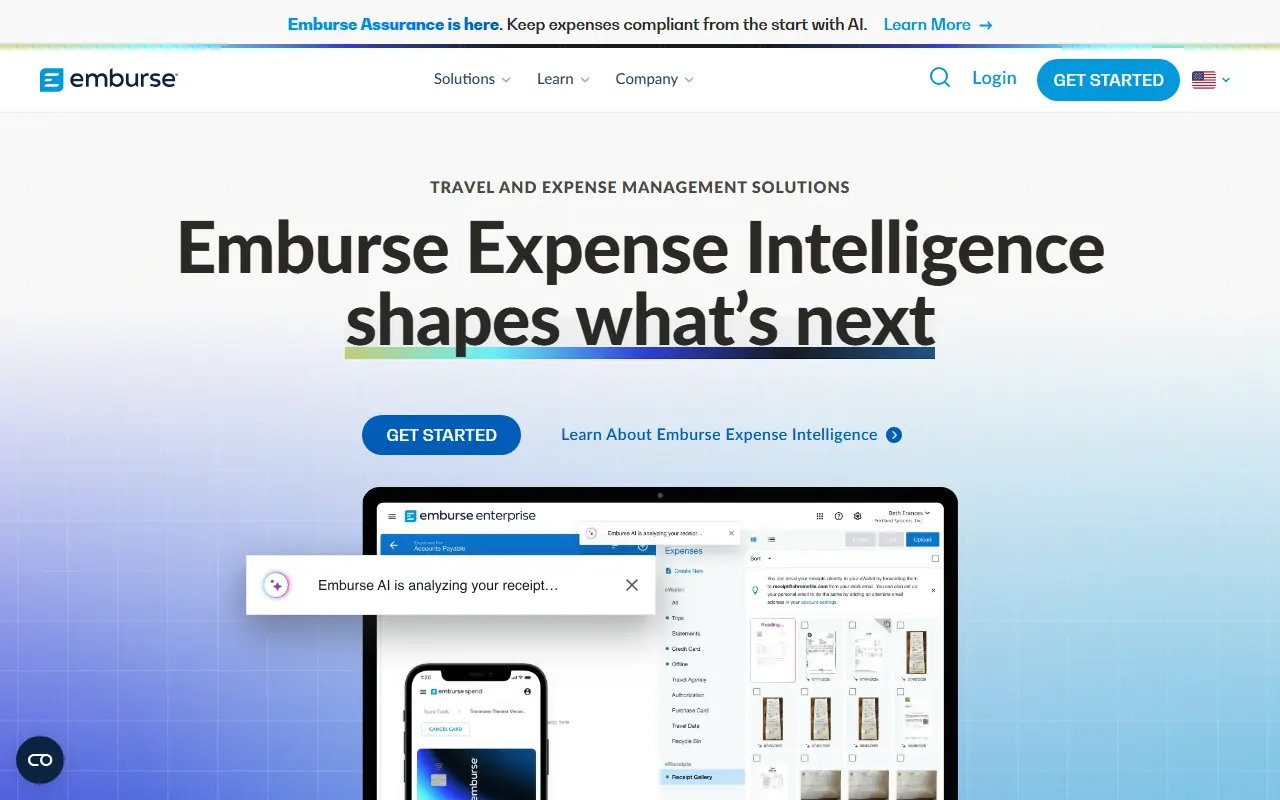
Emburse
Emburse provides automated, AI-powered travel, expense, invoice, and payment management solutions that give businesses real-time visibility and control over their corporate spending.
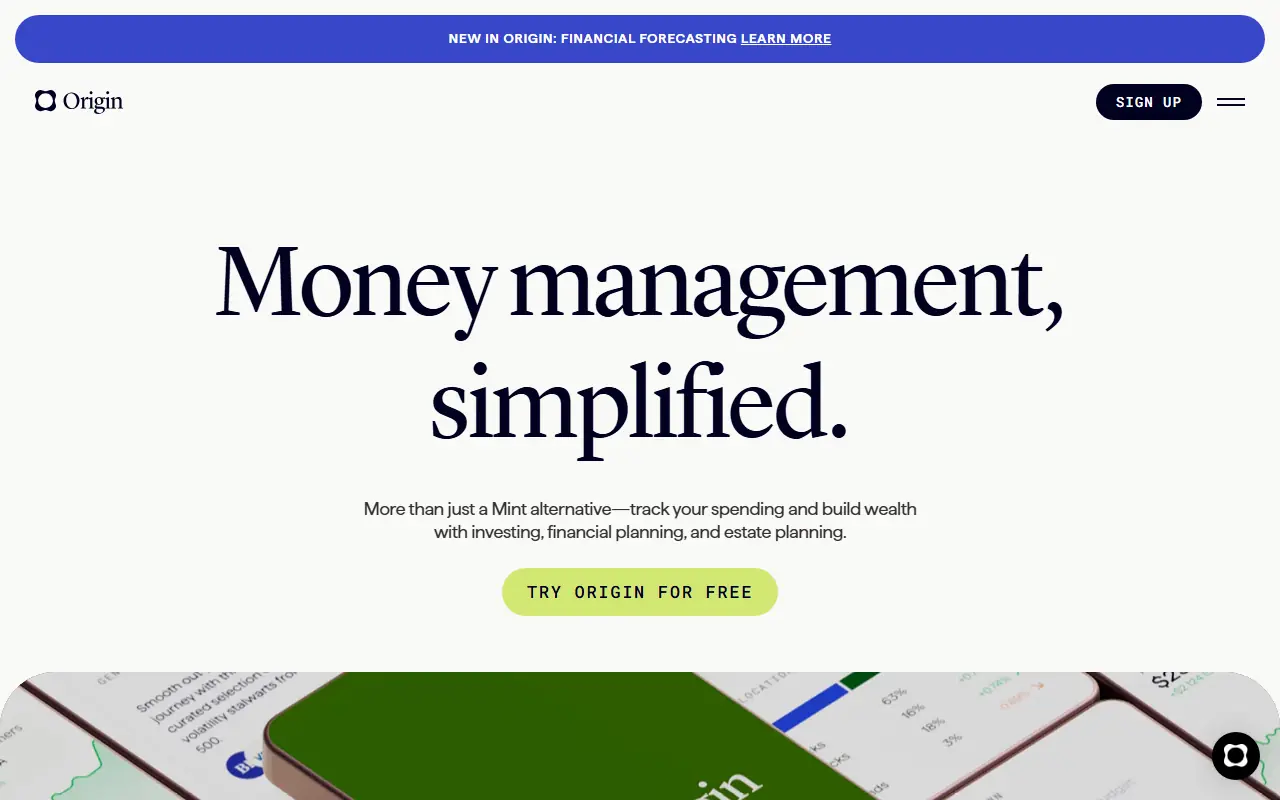
Origin
Origin is a financial wellness platform that provides employees with AI-powered tools and personalized guidance to manage their finances effectively.
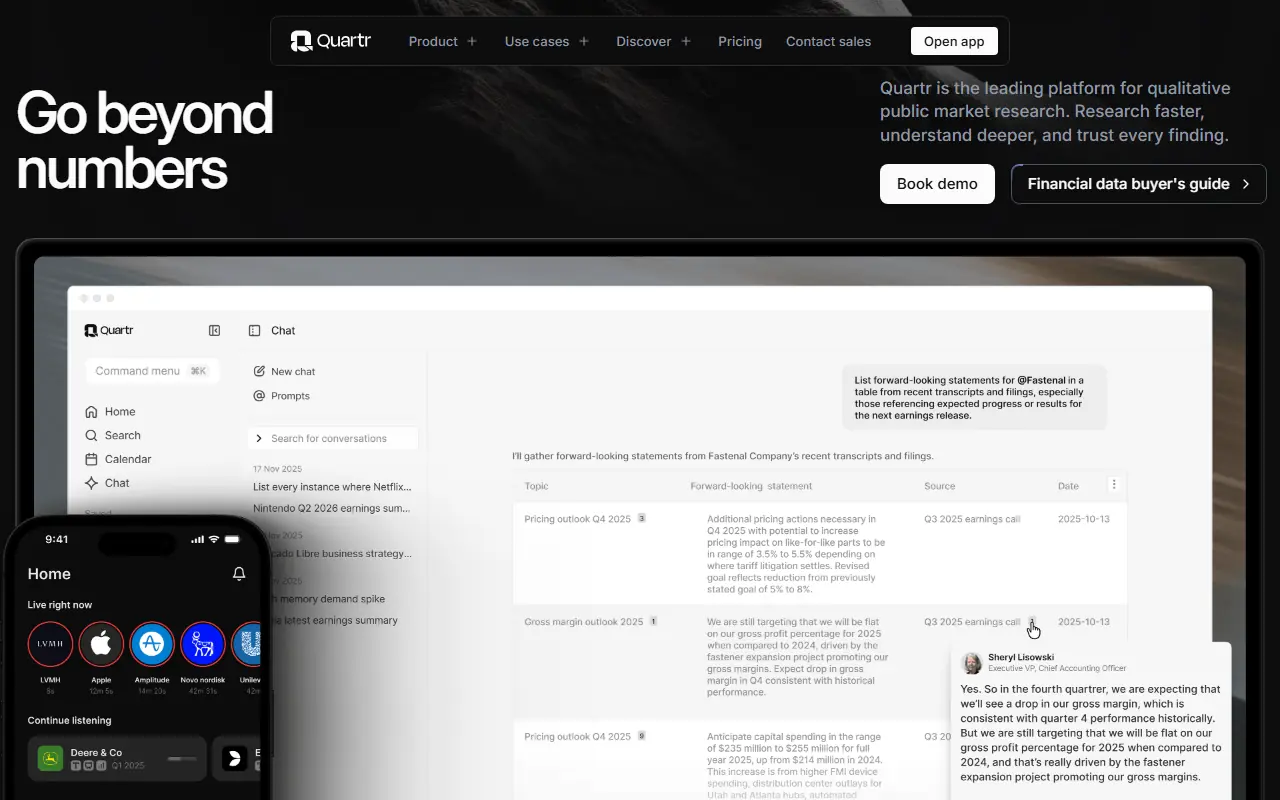
Quartr
Quartr is a powerful financial research platform and mobile app that provides real-time access to live earnings calls, transcripts, filings, and AI-driven insights for public companies.
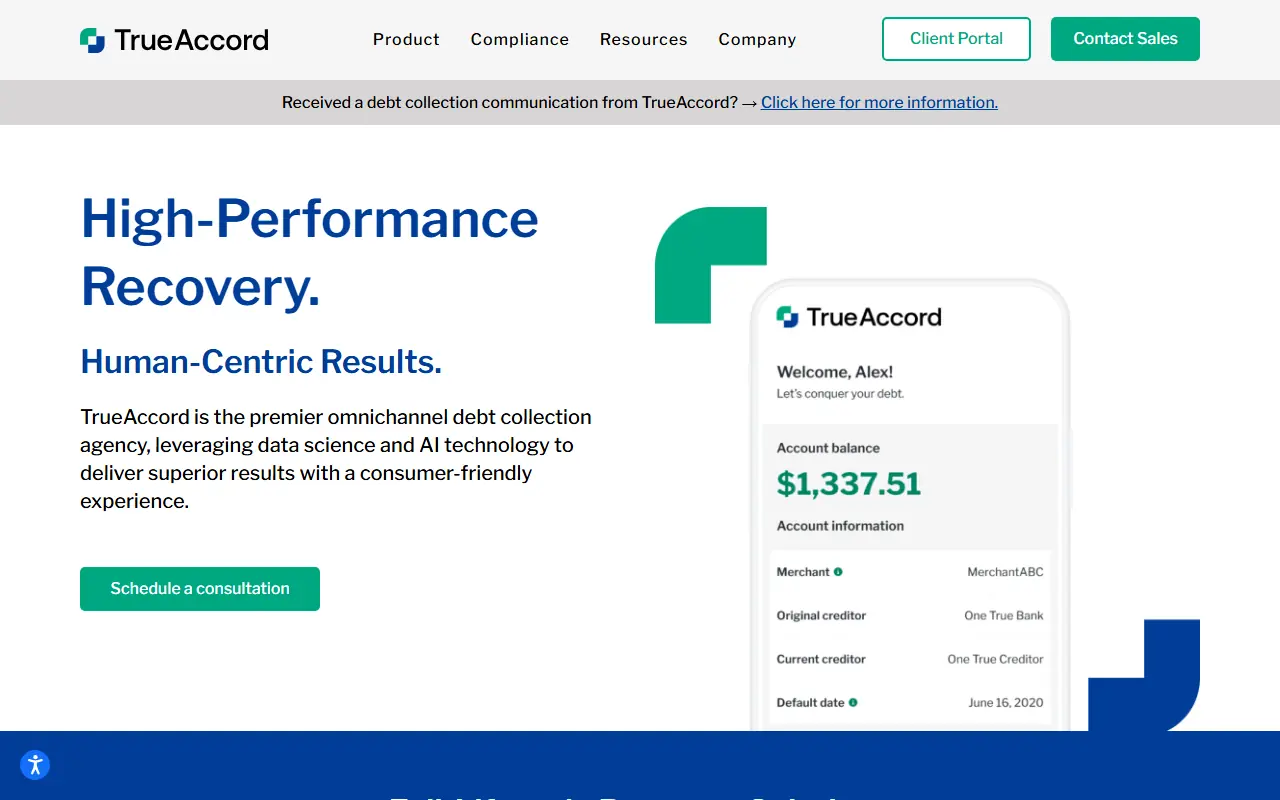
TrueAccord
TrueAccord is a digital-first, omnichannel debt collection agency that leverages machine learning to deliver a personalized, self-serve repayment experience.
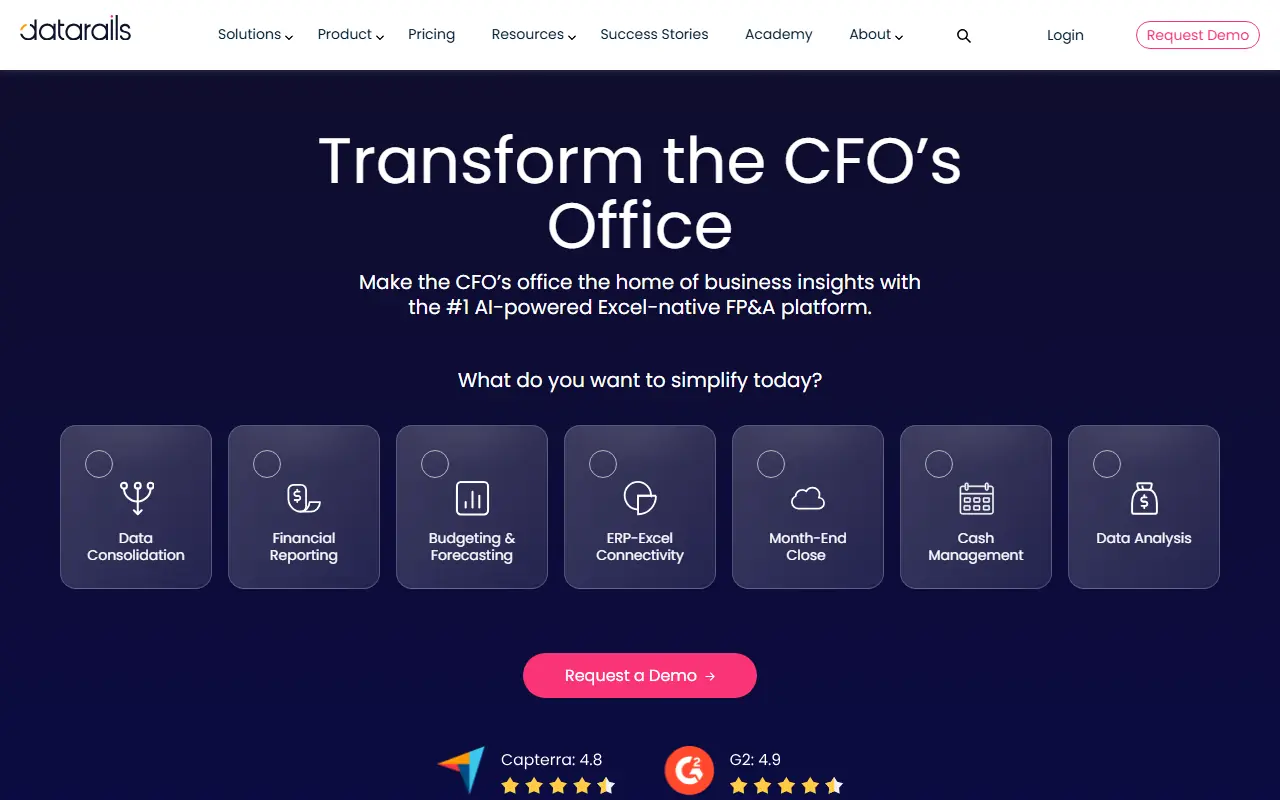
Datarails
Datarails is a financial planning and analysis (FP&A) platform that automates data consolidation, reporting, and budgeting for Excel users.
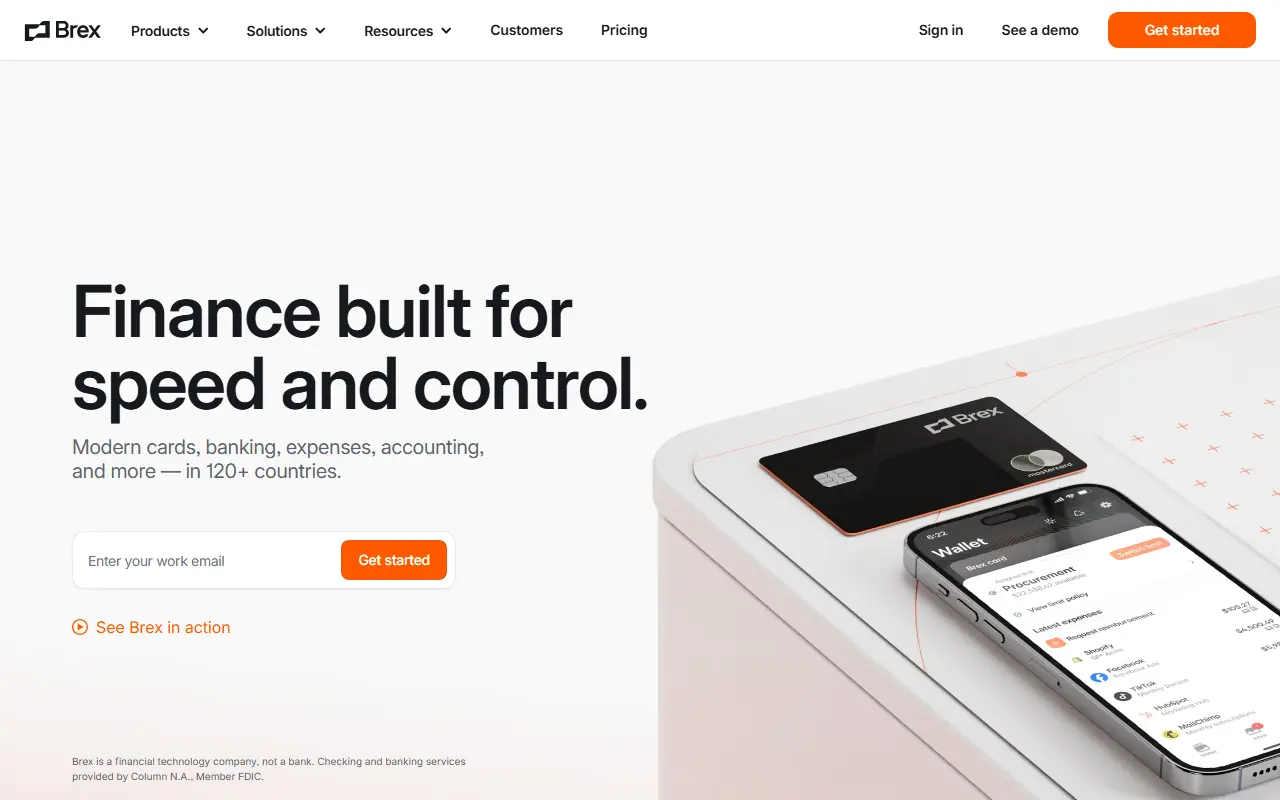
Brex
Brex is a platform offering corporate cards, spend management, and financial solutions tailored for modern companies to streamline expenses and empower growth.
Clarity AI
Clarity AI is a sustainability technology platform that leverages artificial intelligence to provide actionable environmental, social, and governance (ESG) insights for investors and corporations.