LogicMonitor
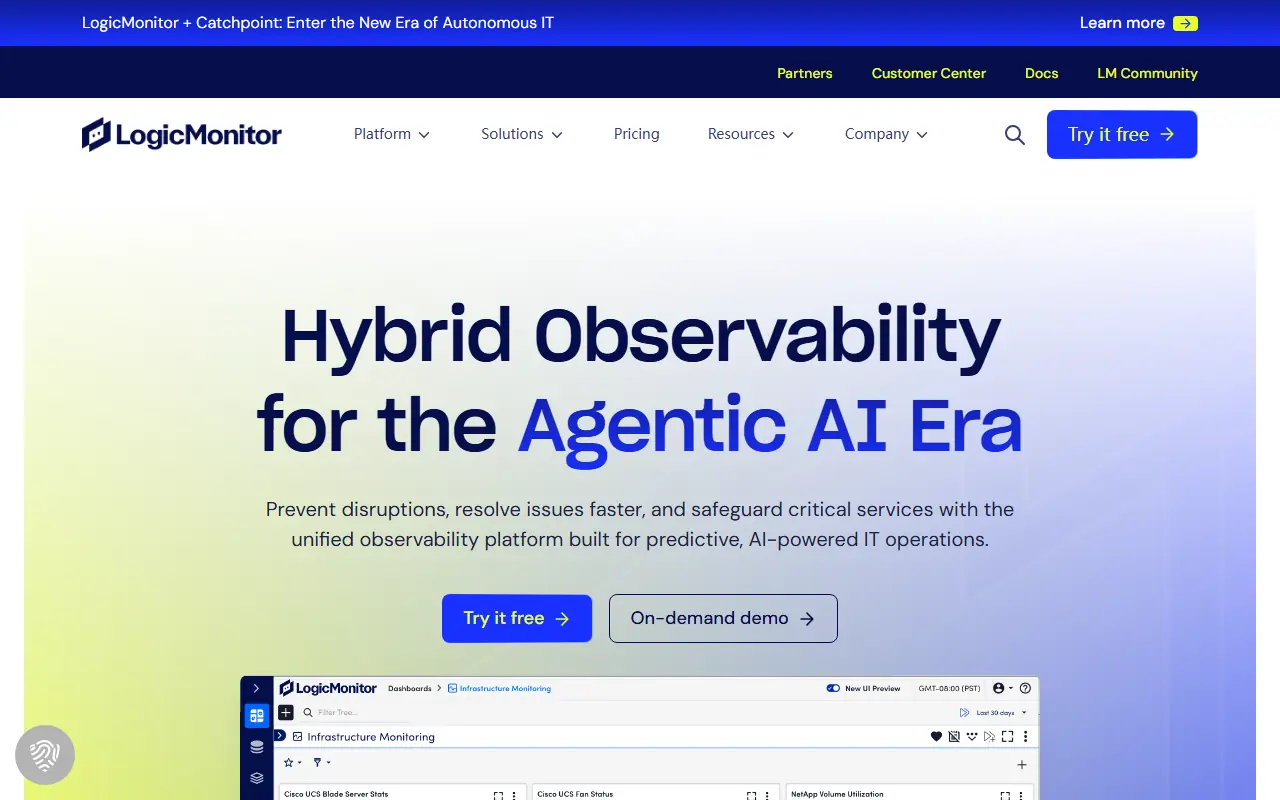
What is LogicMonitor?
LogicMonitor is a leading cloud-based monitoring and observability platform designed to give IT teams deep visibility into their on-premises, cloud, and hybrid infrastructures. Its primary mission is to help organizations proactively manage modern IT environments with predictive insights, intelligent automation, and full-stack observability. By consolidating data from networks, servers, databases, and applications into a single unified view, it effectively eliminates data silos and significantly reduces alert noise. Ultimately, LogicMonitor enables IT operations, DevOps, and cloud teams to detect anomalies early, reduce mean time to resolution (MTTR), and optimize system performance before critical business operations are impacted.
How to use LogicMonitor?
To use LogicMonitor effectively, organizations typically begin by deploying lightweight, API-friendly data collectors that automatically discover and map their IT infrastructure across on-premises networks and cloud environments. Users can then leverage over 3,000 out-of-the-box integrations to connect their servers, databases, and network devices seamlessly to the platform. Once connected, IT and DevOps teams can monitor system health through customizable dashboards, configure automated, AI-driven alerts to minimize noise, and use the integrated Edwin AI assistant for proactive root-cause analysis and incident resolution.
LogicMonitor's Core Features
Provides comprehensive observability into networks, servers, and cloud instances via a unified interface.
Continuously scans and maps IT environments to keep infrastructure topologies automatically updated.
Utilizes artificial intelligence to drastically reduce alert noise and correlate events for faster resolution.
Enables teams to build custom, real-time dashboards representing network health and performance metrics.
Offers over 3,000 out-of-the-box integrations for platforms like AWS, Azure, GCP, and Kubernetes.
Aggregates and intelligently analyzes log data to quickly identify anomalies and system failure root causes.
Deploys an agentic AIOps assistant, Edwin AI, to help teams resolve complex IT incidents proactively.
LogicMonitor's Use Cases
- #1
Monitoring hybrid cloud and multi-cloud infrastructure from a single dashboard.
- #2
Reducing IT alert noise and fatigue using AI-driven event correlation.
- #3
Troubleshooting network, server, and application performance issues.
- #4
Automating IT resource discovery and dynamic topology mapping.
- #5
Analyzing operational logs and retaining critical system events for compliance.
- #6
Forecasting infrastructure capacity needs and managing cloud resource costs.
Frequently Asked Questions
Analytics of LogicMonitor
Monthly Visits Trend: Jun 2025 - May 2026
Traffic Sources
AI Channel Traffic Trends
Top Regions
| Region | Traffic Share |
|---|---|
| United States | 51.16% |
| India | 12.46% |
| United Kingdom | 5.97% |
| Canada | 5.84% |
| Australia | 5.21% |
Top Keywords
| Keyword | Traffic | CPC |
|---|---|---|
| logicmonitor | 12.9K | $24.89 |
| logic monitor | 3.7K | $35.15 |
| telemetry | 84.5K | $2.82 |
| wmi provider host | 25.6K | $0.67 |
| prtg | 14.9K | $17.52 |
Alternative of LogicMonitor
Dynatrace
Dynatrace is a comprehensive software intelligence platform that uses AI and automation to monitor and optimize application performance, IT infrastructure, and digital experiences.
SolarWinds
SolarWinds provides comprehensive IT management and full-stack observability solutions to help organizations monitor, manage, and secure their networks, systems, and applications.
Site24x7
Site24x7 is a comprehensive, cloud-based observability platform that monitors the uptime and performance of websites, applications, servers, networks, and cloud environments.

New Relic
New Relic is an all-in-one observability platform that helps software engineering teams monitor, debug, and optimize their full-stack applications.
Langfuse
Langfuse is an open-source LLM engineering platform that provides observability, analytics, prompt management, and evaluations for AI applications.
PagerDuty
PagerDuty is an incident management platform that leverages AI and automation to help organizations detect, respond to, and resolve operational issues faster.
SuperAGI
SuperAGI is an open-source platform for building, managing, and running autonomous AI agents to automate complex tasks across various domains.
Splunk
Splunk provides a unified data platform for security and observability to help organizations keep their digital systems secure and reliable.