Lucidchart
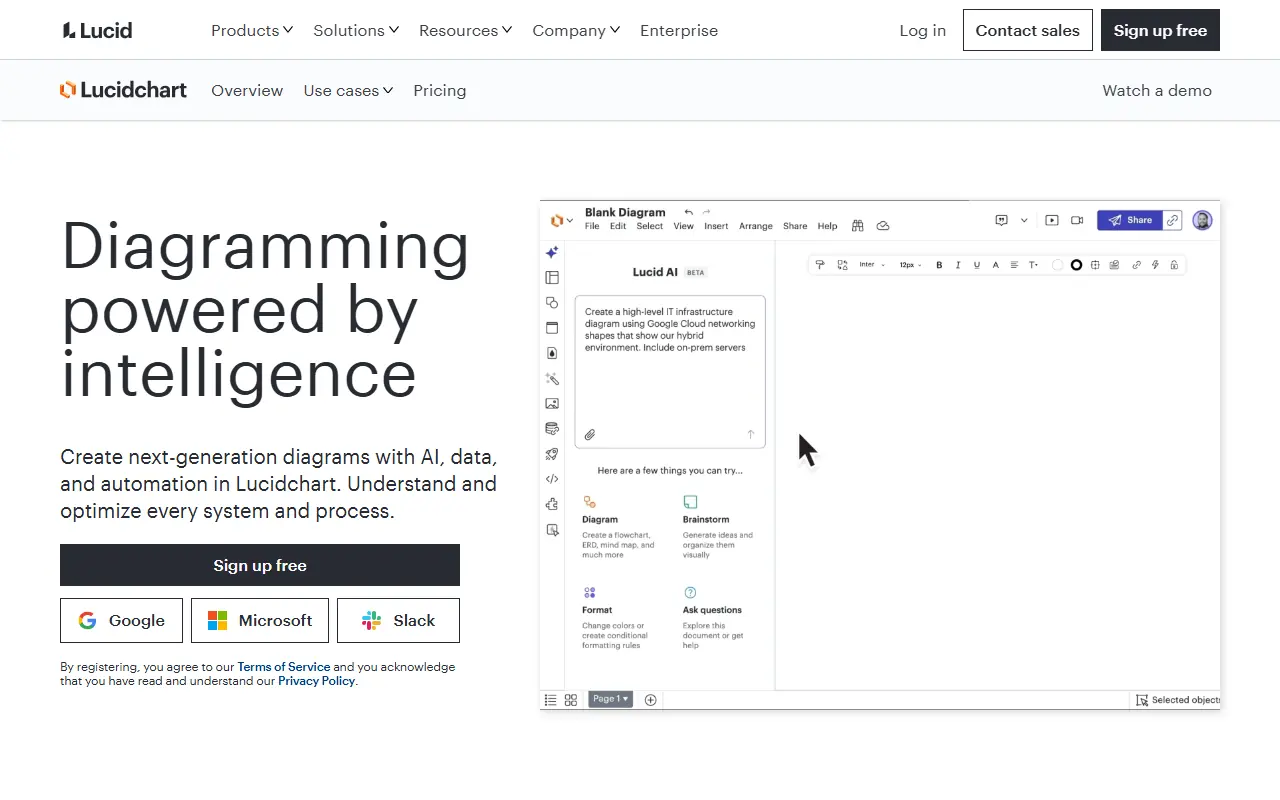
What is Lucidchart?
Lucidchart is a web-based diagramming application that allows users to visually collaborate on drawing, revising, and sharing charts and diagrams. It serves as an intelligent visual workspace that combines diagramming, data visualization, and collaboration to accelerate understanding and drive innovation. Teams use the platform to map out IT architectures, design business processes, and visualize complex software systems. By providing a single source of truth, it helps organizations overcome communication barriers and siloed information across different departments. Ultimately, its mission is to help teams see and build the future by making complex ideas incredibly easy to understand.
How to use Lucidchart?
To use Lucidchart effectively, start by creating an account and selecting a template that fits your project, such as a flowchart, network diagram, or mind map. Drag and drop shapes from the extensive libraries onto the canvas, use lines to connect them to show relationships, and customize colors and text to make the diagram visually clear. You can then invite team members to collaborate in real-time, leaving comments and making edits together, before finally exporting the document or sharing it via a secure link.
Lucidchart's Core Features
Offers an intuitive drag-and-drop interface for easy shape and line manipulation.
Provides hundreds of customizable templates to jumpstart diagram creation for various industries.
Enables real-time collaboration with multiple users working on the same document simultaneously.
Integrates seamlessly with popular platforms like Google Workspace, Microsoft Teams, Slack, and Atlassian.
Allows users to link data from Excel, Google Sheets, or Salesforce directly to diagram shapes.
Includes AI-powered features to automatically generate diagrams, summarize content, and brainstorm ideas.
Supports exporting diagrams in multiple high-quality formats including PDF, PNG, JPEG, and SVG.
Features automated layout tools to keep complex diagrams perfectly organized and aligned.
Lucidchart's Use Cases
- #1
Creating process flowcharts to optimize business operations and workflows.
- #2
Designing detailed network architecture and cloud infrastructure diagrams.
- #3
Mapping out software engineering systems with UML diagrams.
- #4
Brainstorming ideas using interactive mind maps and concept maps.
- #5
Visualizing organizational charts for human resources and management alignment.
- #6
Planning project timelines, user story maps, and agile workflows.
- #7
Creating wireframes and mockups for UI/UX application design.
Frequently Asked Questions
Analytics of Lucidchart
Monthly Visits Trend: Jun 2025 - Jun 2026
Traffic Sources
AI Channel Traffic Trends
Top Regions
| Region | Traffic Share |
|---|---|
| United States | 18.48% |
| Mexico | 6.93% |
| Brazil | 5.37% |
| Peru | 4.02% |
| Colombia | 3.99% |
Top Keywords
| Keyword | Traffic | CPC |
|---|---|---|
| lucidchart | 295.0K | $0.41 |
| lucid chart | 73.7K | $0.82 |
| lucid | 341.6K | $3.98 |
| mapa conceptual | 342.9K | $0.39 |
| diagrama de flujo | 172.2K | $0.54 |
Alternative of Lucidchart
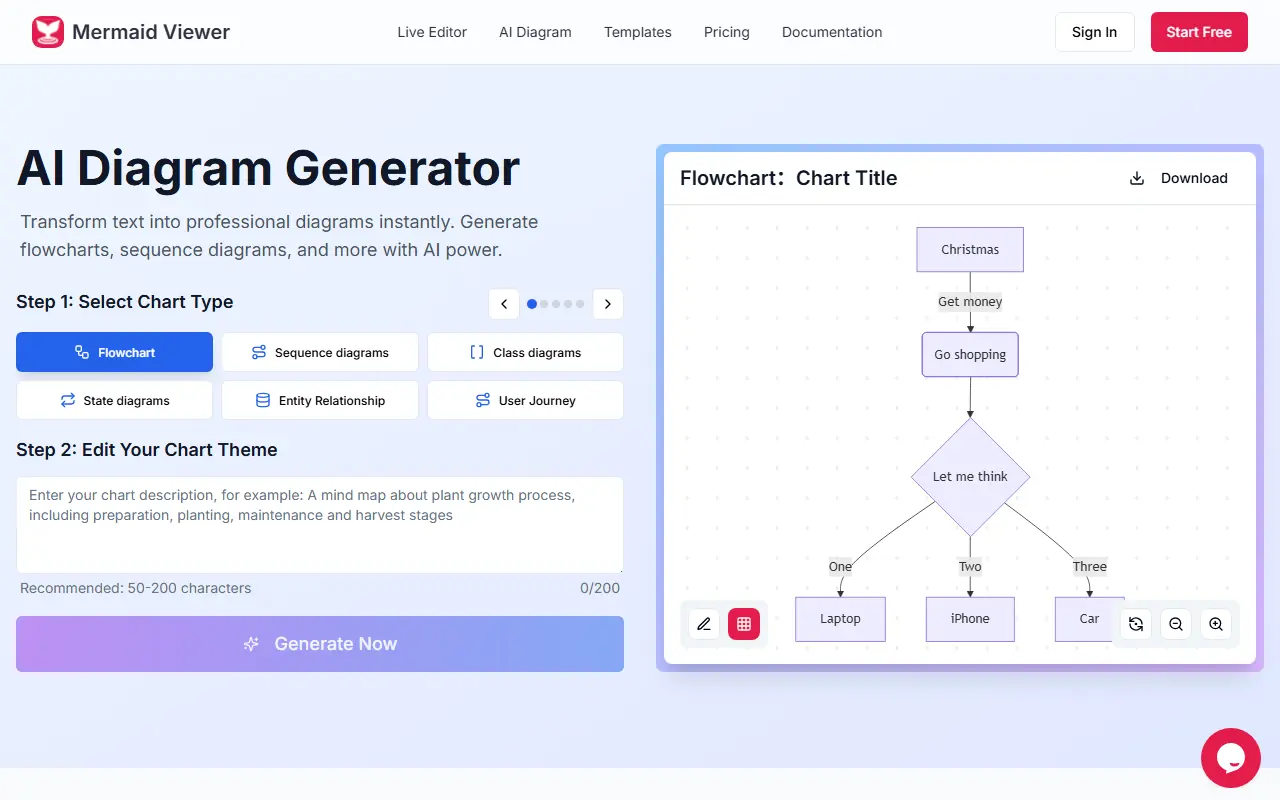
Mermaid Viewer
A browser-based tool that uses AI to transform text descriptions into professional Mermaid diagrams, flowcharts, and charts instantly.
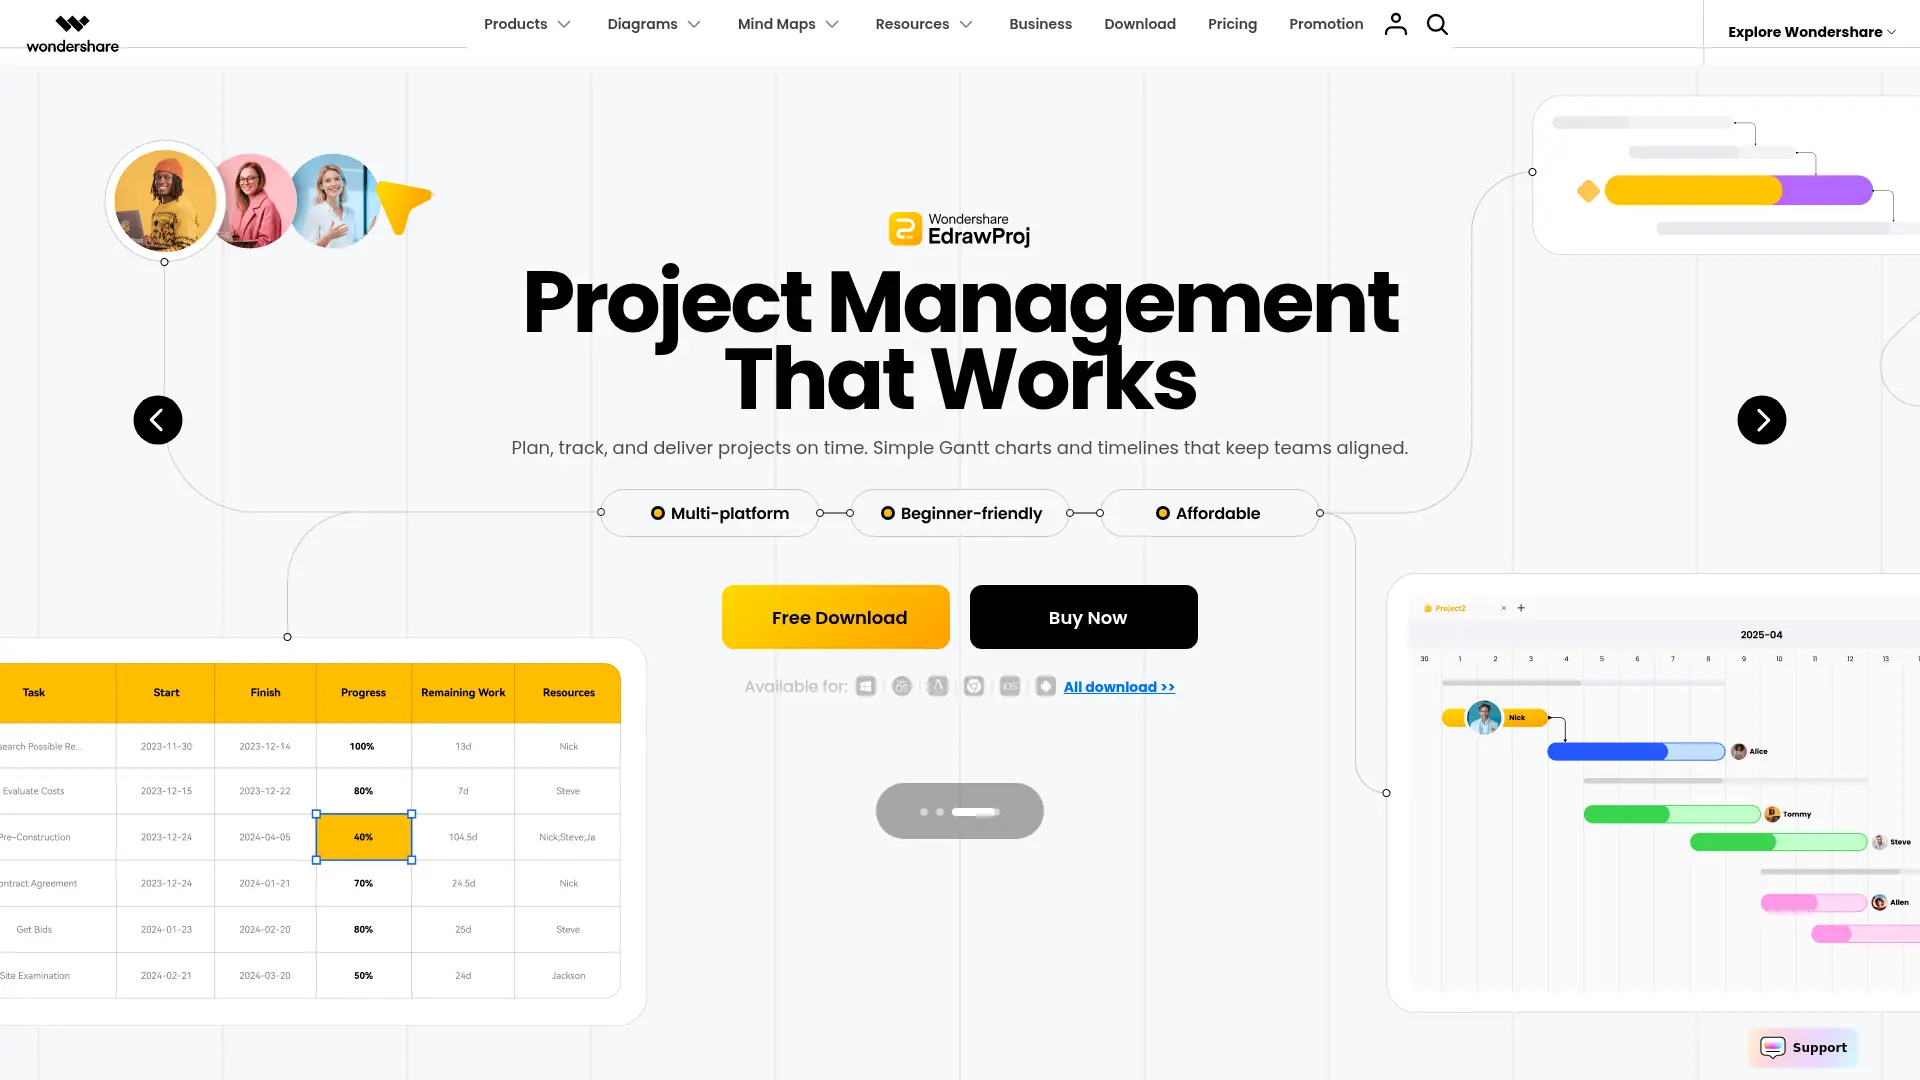
Edrawsoft
A comprehensive, AI-integrated visual workspace that generates scalable diagrams, technical schematics, and mind maps to streamline collaboration and technical documentation.

Creately
Creately is an AI-powered visual collaboration and diagramming platform that helps teams visualize, connect, and execute ideas faster on a smart infinite canvas.
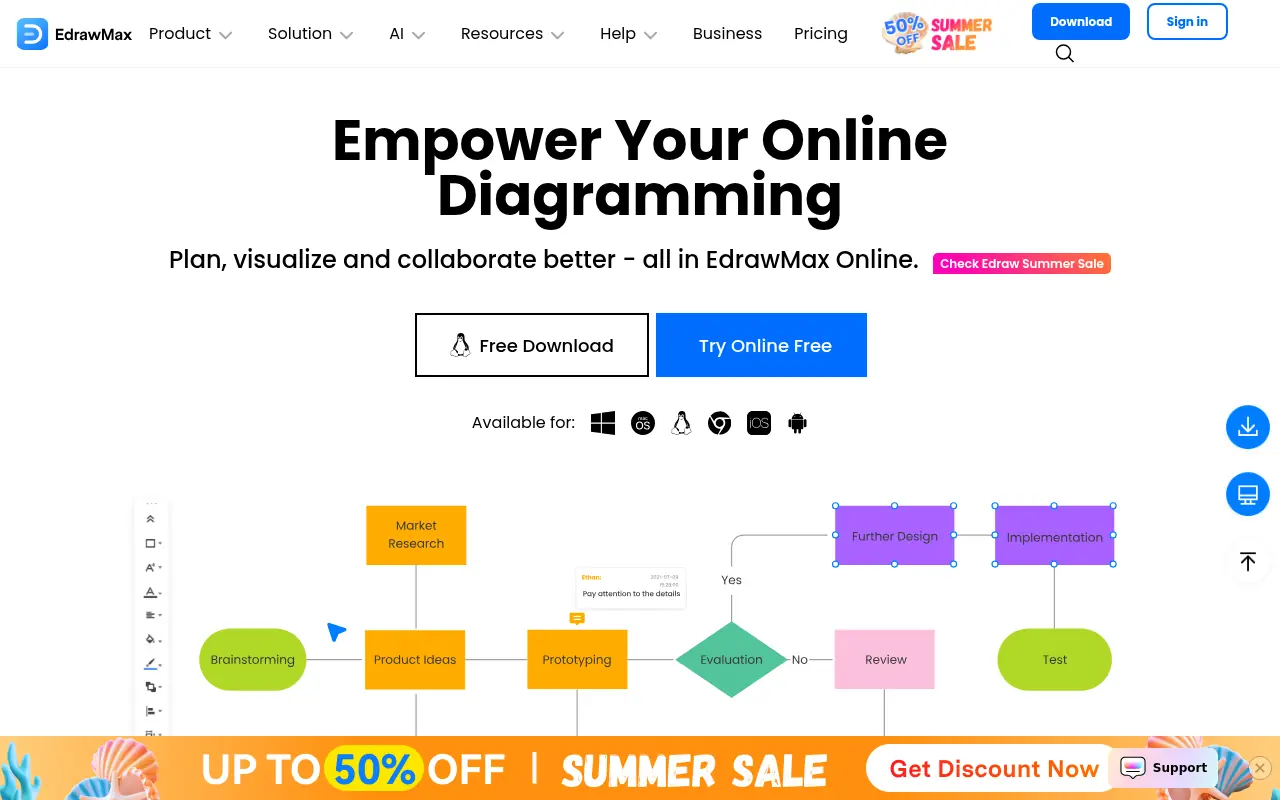
EdrawMax
EdrawMax is an all-in-one diagramming tool powered by AI for creating professional flowcharts, mind maps, and over 280 types of diagrams.
Edraw.AI
Edraw.AI is an AI-powered platform for creating professional diagrams, flowcharts, and mind maps to enhance visual collaboration and productivity.
Mermaid AI
Mermaid AI is an intelligent platform that allows users to instantly generate, edit, and collaborate on diagrams using natural language prompts, code, or a visual editor.
Eraser
Eraser is a collaborative platform for engineering teams to create, edit, and share technical documentation and diagrams.
BioRender
BioRender is an intuitive, web-based platform that empowers scientists and researchers to create professional, publication-quality scientific figures and illustrations.