Narrative BI
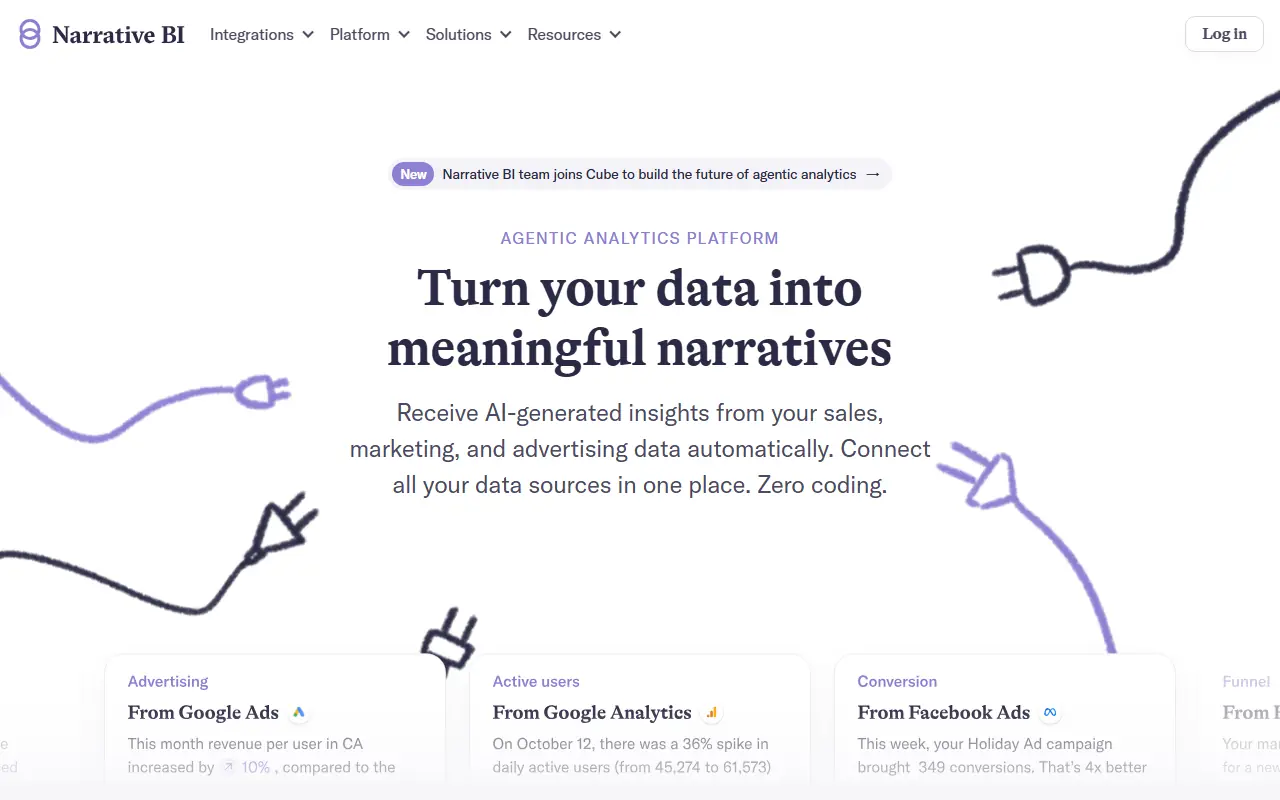
What is Narrative BI?
Narrative BI is a generative analytics platform designed for marketing teams, growth teams, and agencies that automates the process of converting raw data into actionable business narratives. The platform connects to popular data sources like Google Analytics, Google Ads, Facebook Ads, HubSpot, Salesforce, and Slack to provide real-time insights in natural language format. It solves the problem of data fragmentation and complexity by offering automated report generation, 24/7 anomaly detection, and AI-powered recommendations that help teams make faster, data-driven decisions. Users can ask questions about their data in plain English using the AI Data Analyst tool and receive instant insights with visualizations and strategic guidance. The platform eliminates the need for manual report creation and distribution while providing scheduled automated insights at the frequency of choice.
Featured
SponsoredHow to use Narrative BI?
Start by signing up and connecting your data sources (Google Analytics, Ads, HubSpot, Salesforce, etc.) through a simple two-click integration process. Once connected, Narrative BI automatically generates personalized data narratives and feeds them to your dashboard. You can set up scheduled reports to be delivered automatically to your team or clients at your preferred frequency (daily, weekly, monthly, or annually). Use the AI Data Analyst feature by asking questions about your data in plain English, uploading CSV/XLSX files, or exploring generated narratives with follow-up questions to uncover deeper insights. Invite team members to collaborate, customize metrics you want to track, and configure notifications for anomalies detected in your data.
Narrative BI's Core Features
Automatically generates natural language data narratives from raw business data without manual analysis.
Connects to 20+ popular data sources including Google Analytics, Ads, HubSpot, Salesforce, and Slack.
AI Data Analyst enables conversational data exploration using plain English questions for instant insights.
24/7 anomaly detection proactively alerts you to unexpected data spikes and changes in metrics.
Scheduled automated report delivery to team members or clients at customizable frequencies.
In-narrative collaboration allowing multiple team members to discuss and add context to insights.
Multi-workspace feature to manage separate clients and campaigns within a single account.
Customizable metric tracking with ability to mute or focus on specific metrics for each report.
GPT-powered AI recommendations provide actionable next steps and strategic guidance.
Easy Slack integration to monitor key metrics directly in your Slack workspace.
Flexible pricing based on data sources connected, with reduced per-source costs as you scale.
Team collaboration with granular permission controls for different user roles.
Narrative BI's Use Cases
- #1
Marketing agencies automating client report generation and delivery without manual effort
- #2
Growth teams identifying data anomalies and trends in real-time across multiple marketing channels
- #3
Sales organizations monitoring pipeline health, conversion rates, and revenue metrics from CRM data
- #4
Multi-client businesses tracking separate campaigns and metrics for each client using workspaces
- #5
Executives receiving automated AI summaries of key business metrics to inform strategic decisions
- #6
Product managers analyzing website traffic patterns and user behavior to optimize site performance
- #7
Finance teams tracking KPIs and detecting unusual spending patterns or budget variances
- #8
Agencies combining CRM, marketing, and advertising data to provide holistic client insights
Frequently Asked Questions
Analytics of Narrative BI
Monthly Visits Trend
Traffic Sources
Top Regions
| Region | Traffic Share |
|---|---|
| United States | 37.77% |
| India | 14.70% |
| Brazil | 6.61% |
| United Kingdom | 6.29% |
| Mexico | 6.29% |
Top Keywords
| Keyword | Traffic | CPC |
|---|---|---|
| narrative bi | 440 | $0.87 |
| marginal cost curve ai that does it | 230 | -- |
| cpv calculator | 1.4K | -- |
| gpt insights | 240 | $3.01 |
| what is anomaly | 650 | -- |
Alternative of Narrative BI
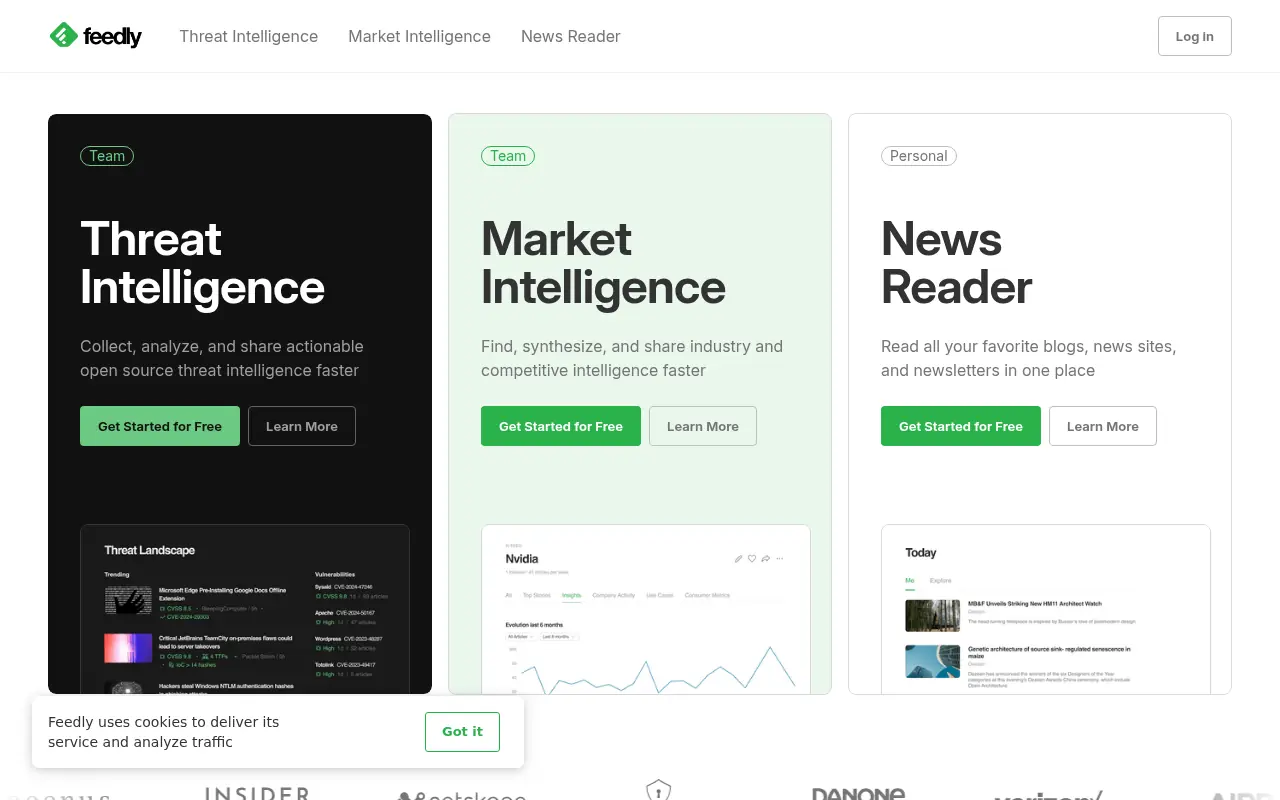
Feedly
Feedly is a news aggregator that curates personalized content feeds for individuals and teams to stay informed on topics that matter.
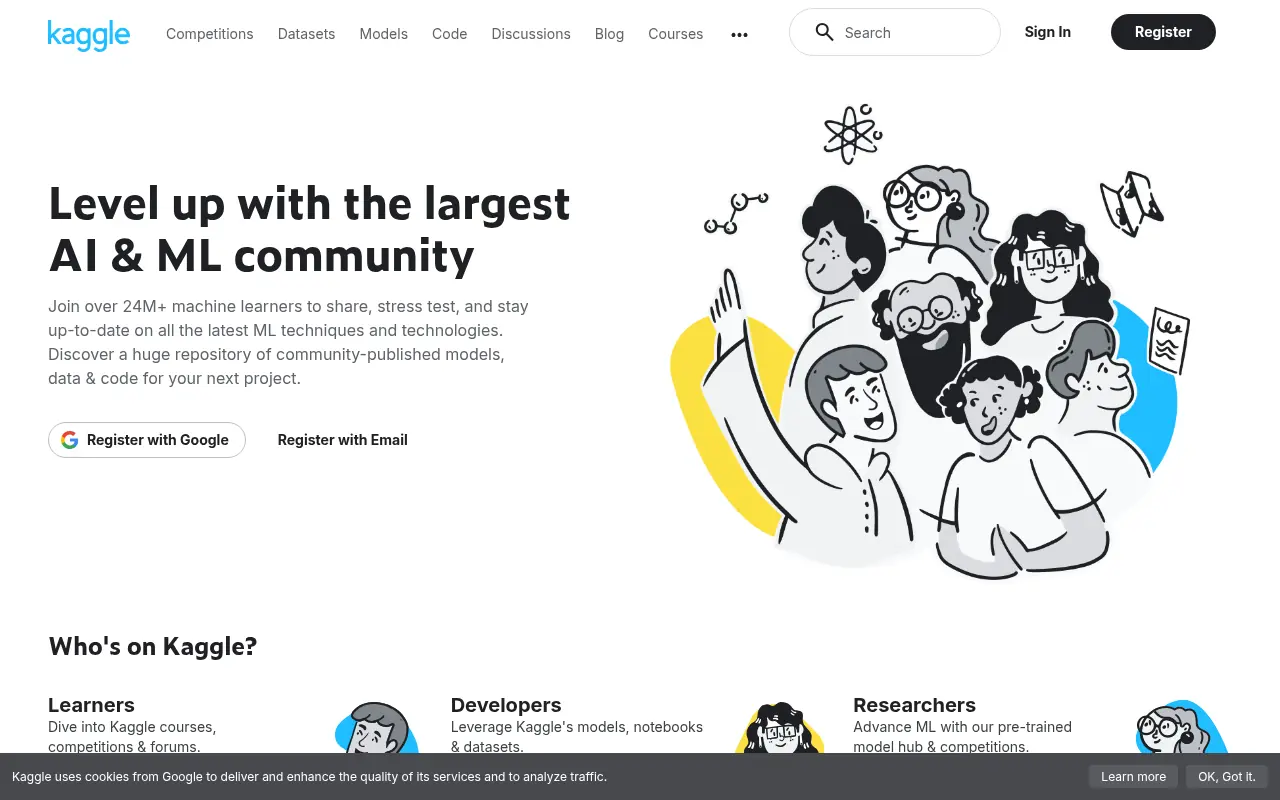
Kaggle
Kaggle is a global platform for data science and machine learning, offering competitions, datasets, and collaborative tools for professionals and learners.

Tableau
Tableau is a powerful visual analytics platform that empowers individuals and organizations to explore, analyze, and securely share actionable data insights.
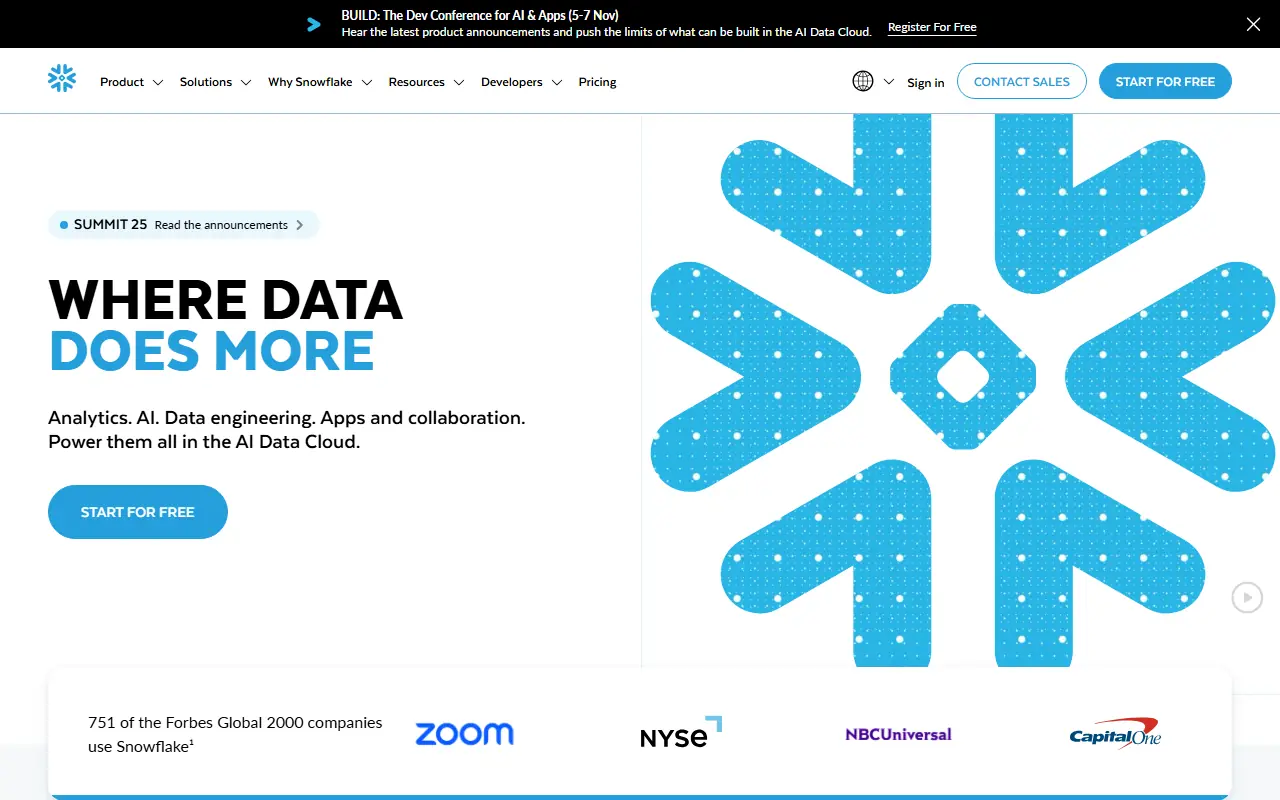
Snowflake
Snowflake is a cloud-based data platform that enables scalable data storage, analytics, and AI-driven insights for enterprises.
Databricks
Databricks provides a unified Data Intelligence Platform that combines the best of data warehouses and data lakes to accelerate data, analytics, and AI initiatives.

Astra AI
Astra AI is a cutting-edge platform that harnesses artificial intelligence to provide advanced data analysis and business intelligence solutions.
PostHog
PostHog is an all-in-one, open-source product analytics platform that helps engineers and product teams understand user behavior, test features, and build better products.
SAS
SAS is a leading provider of analytics, artificial intelligence, and data management software and services that help organizations turn data into actionable insights.